Skip to content

COVID-19 Science Update for March 25th: Understanding Models

This clustering phenomenon explains why the COVID-19 policy debate among politicians, doctors, and pundits now has become somewhat surreal, with world-class experts telling us either that we are facing an “apocalypse,” or that the pandemic will fizzle and we’re all “going to be fine.”

· 12 min read
COVID-19 Science Update for March 25th: Understanding Models
Screenshot from Our World in Data.

The latest global data for COVID-19—updated with reports received on March 25th, 2020—have been published at Our World in Data. Here are some of the numbers and trends that I believe deserve special attention, as well as a brief report on notable developments and analyses. Since March 21st, these updates have been published at Quillette in our section marked COVID-19 UPDATES. Please report needed corrections or suggestions to jon@quillette.com.

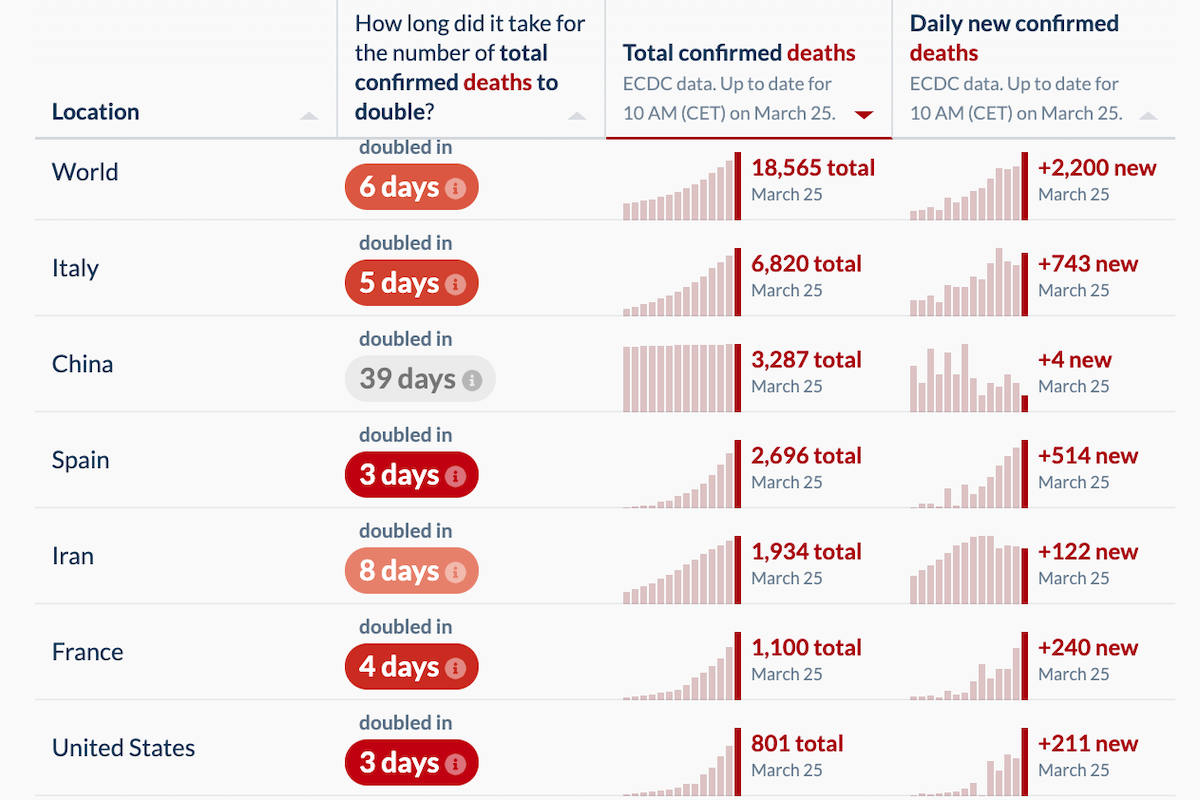
The number of newly reported deaths increased yesterday. There were 2,200 new confirmed COVID-19 fatalities, compared to 1,764 reported on Tuesday, 1,660 on Monday, and 1,690 on Sunday. This was largely due to increased death tallies in France (240 new deaths, up from 186 the day before), Italy (743, up from, in reverse order, 601, 649, and 795), Spain (514, up from 462) and the United States (211, up from 119).

The Netherlands had an unsettling jump to 63 new deaths (up from 34 on Tuesday). And some bad news in Sweden, which I discussed yesterday as being a European outlier due to its liberal approach amid the COVID-19 pandemic: 11 new deaths, representing an almost 50 percent jump in its total cases.

Otherwise, the trends I’ve discussed in previous updates continued, with many countries exhibiting death rates that roughly reflect the surge in newly detected cases that came online in early and mid-March, including: Denmark (8 new deaths), Canada (3), Belgium (34), Germany (23), Israel (2), Portugal (10), Switzerland (20), the UK (87), and Turkey (7).

The number of newly reported cases (as opposed to deaths) was down slightly, from 39,737 yesterday to 38,876 in today’s numbers. But for a number of reasons, including the rapidly changing testing landscape in many parts of the world, the new-case figures now seem less important than other data when it comes to gauging the readiness of our health systems—such as the number of new deaths, the proportion of severe and critical cases among living COVID-19 patients, and patterns of geographic concentration.

In this update, I will briefly discuss the data in regard to new deaths, but then focus closely on the emerging policy debate about how best to fight COVID-19. The last 10 days have witnessed a proliferation of different proposals, which are in turn based on new computer models that seek to predict the spread of the disease. My goal is to explore some of the main findings from these models, as well as the (sometimes questionable) assumptions on which they are based.

Just four countries—France, Italy, Spain, and the United States—represented 78 percent of newly reported global COVID-19 deaths today. This has become a regular theme in these daily updates. I went back and looked at the percentage of daily global COVID-19 deaths that were represented by these four countries since the beginning of March. As shown in Figure 1, it has been at least 50 percent since March 7th (with one daily exception), more than 65 percent for the last two weeks, and at or about 75 percent for the last week.

Consider that the incubation period associated with COVID-19 is thought to be just five days. And so even before much of Europe and the United States started moving toward lockdown mode, there was plenty of time for this pandemic to migrate widely and germinate large-scale outbreaks in other countries with similar climates, population density, socioeconomic profiles, and health systems. But that didn’t happen, at least not yet. And as discussed in more detail below, experts are struggling to explain why.

Even as early as late February, when the Report of the WHO-China Joint Mission was published, doctors noted that “most locally generated cases have been clustered,” with the majority of spread occurring in households. But this clustering effect seems to take on a strangely fractal quality—operating at multiple scales, including (1) household (the main vector in China), (2) civic community (the Shincheonji Church of Jesus offering an extreme example), (3) city/region (Lombardy versus southern Italy; New York City versus the rest of the United States), and, as discussed in the previous paragraph, (4) nation. For reasons that aren’t yet clear—again, even among experts—the disease spreads quickly within a cluster, then slows down at its edges.

In keeping with the fractal character I am describing here, graphs such as those contained in Figure 1 could be produced at different levels of scale, showing how a single region of South Korea, Daegu, accounts for two-thirds of all the country’s cases. And within that regional geographical cluster, roughly two-thirds were members of a single religious group (the aforementioned Shincheonji Church). Case clustering occurs naturally in many diseases, of course (especially contagious diseases). But the patterns at play here don’t seem to match previous pandemics.

In Wuhan, to take another example, the first cases of what was then described as a “novel coronavirus disease” appeared as early as December. Weeks passed before the central government moved decisively to contain the new disease. Wuhan is a regional transport hub with a population of 11 million. And during the period leading up to Chinese New Year, travellers from all parts of the country were passing through the city. According to the mayor, about 5 million residents left Wuhan in the weeks before a lockdown was imposed. Some of those people, as the World Health Organisation (WHO) report put it, “generated limited human-to-human transmission chains at their destination.” Yet the number of new daily cases outside Hubei province peaked at about a thousand in late January, while daily highs in the city of Wuhan alone were more than double that. Why?

The word “cluster” appears in the WHO report a dozen times, and even is embedded in China’s articulated strategy for suppressing COVID-19, which includes “differentiated risk-based containment strategy to manage the outbreak in areas with no cases vs. sporadic cases vs. clusters of cases vs. community-level transmission.” Chinese officials believe that identifying clusters will be “essential for ensuring a sustainable approach while minimizing the socio-economic impact”—coded language indicating that clusters need to be locked down even while daily life in the rest of the country comes back online. And it’s become clear that other acutely affected countries will have to do likewise, including the United States.

This clustering phenomenon explains why the COVID-19 policy debate among politicians, doctors, and pundits now has become somewhat surreal, with world-class experts telling us either that we are facing an “apocalypse,” or that the pandemic will fizzle and we’re all “going to be fine.” If you choose to focus on intra-cluster dynamics, it looks like a horror movie. If you take a broader perspective, it looks very different.

In China, for instance, the initially estimated basic reproduction number—R0 (often pronounced as “R-nought”)—was 2.5, which would mean that the expected number of additional cases directly generated by one infected person would be 2.5. And of course, those infected people can go on to infect others. The most pessimistic models you are now seeing reported in the media tend to emerge by applying an R0 figure of at least 2—I have seen a range between 2.2 and 2.6 used, but 2.4 seems to be a commonly applied value—to great swathes of the planet’s population, and then iterating exponentially over time. That’s how you get those scary headlines about almost 2 million Americans dying within the year. But again, that doesn’t tell the whole story.

R0 is a really important parameter. One of the reasons measles has been such a terrible scourge upon humanity is that its R0 is extremely high (traditionally reported as being between 12 and 18). And one of the reasons MERS killed relatively few people (despite its high case fatality rate) is that its R0 is low.

Moreover, the concept of R0 is fundamental to the idea of “herd immunity,” which you will hear being thrown around a lot in coming weeks. The idea here is that even if you and I aren’t vaccinated or otherwise immune to disease X, we’ll be protected if everyone around us is immune. R0 figures into this because herd immunity is a moving target based on how easy it is to catch a disease. When R0 is high, as with measles, vaccination rates in excess of 90 percent are generally required to prevent outbreaks. But for a disease such as COVID-19, with a lower R0, the herd-immunity threshold is closer to 50 percent.

COVID-19 Science Update for March 26th: Five Trends Shaping Medium-Term Policy
Sydney. London. Toronto.

This herd-immunity tangent is necessary, because there have been a number of influential figures who’ve suggested that the path forward might be to “build up some kind of herd immunity” by (presumably) permitting a substantial number of people to get the disease. Such a policy would be extremely controversial, obviously. But you also hear the concept of herd immunity discussed in a very different context: According to a model created at Oxford’s Evolutionary Ecology of Infectious Disease group, as much as half of Britain’s population already has been infected with some imperceptible form of COVID-19—which, if true, would mean both that the mortality rate is much lower than we thought, and that we have all been spending recent weeks developing some form of herd immunity to COVID-19 without even realizing it.

This kind of framework is well-developed science among epidemiologists, who’ve created various strategies for overcoming some of the problems I’ve been discussing (including those associated with heterogeneous populations more generally). But as with all forms of modelling, the results are only as valid as the underlying presumptions and parameters. And in the case of COVID-19, it’s not clear that transmission dynamics can be helpfully represented by a single baseline R0 value once you move outside an affected cluster (or even scale-shift from a smaller cluster to a larger one).

It’s crucial to remember that R0 is not a biological constant that relates to either humans or pathogens. It’s merely a useful mathematical artifice that can be applied in situations where uninfected, non-immunized individuals in a studied population are susceptible to infection in a way that can be modelled over time in some universal, abstract way. But COVID-19 has been a hard target to track. This is not only because of what appear to be the unusual clustering properties of the virus, but also because of a more general problem: The idea of R0, which dates to 19th century models used to predict population growth, rests on some expectation of sociological constancy. But the nature of modern communications in the smartphone era means that, for the first time in history, entire societies can radically shift the way they interact with one another in the space of days or even hours. Moreover, social media now allows—and, in fact, encourages—crowdsourced norm-enforcement protocols (mobbing, basically) by which individuals who, say, post selfies at a party or concert will be widely attacked. We now live in a world where people in Australia or India can use Twitter to shame a New Yorker into staying in for dinner. For better or worse, this is unprecedented.

The spread of COVID-19 generally requires that droplets from one person’s respiratory tract make their way to another person’s respiratory tract—a process that typically requires close, unguarded, real-time proximity to a person who is coughing, sneezing, or spitting up—or via a contaminated fomite, such as a doorknob or kitchen utensil. Avoiding transmission is relatively straightforward. And so, even before lockdowns were imposed, billions of people around the planet already were able to modify their behaviors in simple but effective ways that helped minimize transmission, from washing their hands to sneezing into their arms. In the short term—as Quillette editor-in-chief Claire Lehmann argued in a March 3rd editorial—governments should intervene decisively to ban large gatherings and implement social-distancing policies. But these measures always will be layered over the decisions and actions of the ordinary people who now spend much of their waking life doing little except reading and talking about COVID-19.

This daily update is not presented as a systematic critique of published COVID-19 models (which lies well beyond my expertise anyway). But it is helpful to focus on one particularly influential paper published last week under the auspices of the Imperial College COVID-19 Response Team, titled Impact of non-pharmaceutical interventions (NPIs) to reduce COVID-19 mortality and healthcare demand.

If you’re interested in COVID-19 modelling, I would urge you to download the Imperial College report (as it is often described), which is written in a language that a focused layperson can understand.

Overall, the vision here is not optimistic. Simulated epidemics were modelled in the United States and the UK under a variety of assumptions, broadly grouped under (a) mitigation, which focuses on “slowing but not necessarily stopping epidemic spread—reducing peak healthcare demand while protecting those most at risk of severe disease from infection,” and (b) suppression, which “aims to reverse epidemic growth, reducing case numbers to low levels [i.e., R0 < 1] and maintaining that situation indefinitely.”

While some modelled scenarios yielded better results than others, the Imperial College authors conclude that we need to pick our poison: Mere mitigation can lead to a massive short-term spike in sickness that completely overwhelms intensive care units—the horror show in Lombardy, but on the scale of whole nations. Suppression, on the other hand, may help avoid catastrophe in the short term—but at a long-term cost. Because “[government] interventions can limit transmission to the extent that little herd immunity is acquired—leading to the possibility that a second wave of infection comes once interventions are lifted.”

This prospect of COVID-19’s cyclical reappearance is illustrated in the paper as two overlaid repeating sawtooth patterns: Declining COVID-19 activity leads to a relaxation of government policy, which leads to a spike in ICU admissions, which triggers a return to lockdown, which suppresses the virus—and then the whole pattern repeats itself.

The paper has received praise from many. But the model it contains looks less convincing when you run down the list of literally hundreds of (necessarily) arbitrary-seeming assumptions embedded within. For instance, will a policy of “social distancing of those over 70 years of age” have the effect of “reduc[ing] contacts by 50% in workplaces, increase[ing] household contacts by 25% and reduc[ing] other contacts by 75%, assum[ing] 75% compliance with policy”? Who knows. And since these models are iterative, non-linear mathematical systems, even fairly small errors in defined parameters can lead to very different results (as any climatologist can attest).

But my larger critique lies with the rigid on-again/off-again dynamic represented in that sawtooth pattern. Yes, governments can turn their own policies on and off by fiat. But all of us have spent the last few weeks learning whole new codes of human behaviour that will continue to govern—or at least influence—the way we socialize, eat, shop, and commute for years. Even if it were true that the R0 associated with COVID-19 was 2.5 at a time when Wuhan residents were going about their lives with little knowledge of the disease, it’s almost certainly not true anymore.

In some ways, these new behavioural norms are just as important as government policy, especially since they are being enforced by employers without public prodding: Many large companies ordered white-collar employees to telecommute long before they were required to do so. This took place around the same time all of my kids’ sports leagues were canceled, as were the various speaking events I was supposed to attend.

Yes, the basic idea that our behaviour can be governed by sawtooth policy swings might have made sense many decades ago, when citizens didn’t have the information-gathering and communication tools they do now. But the assumption seems more dubious in 2020. And that may well play to our advantage, since the naturally occurring flywheel effect created by these sticky new norms can help smooth out the boom-and-bust sawtooth pattern described in the Imperial College paper, and thereby permit—if you will excuse my avalanche of mixed metaphors—a stable and humane glide path into herd immunity.

And in tomorrow’s update, I will put aside the issue of modelling, and focus on a few recent policy and science developments that, taken together, may help us eventually accomplish that task.

Latest Podcast

Join the newsletter to receive the latest updates in your inbox.

Sponsored

On Instagram @quillette