Economics
Why Assumptions About Rising Inequality Are Wrong
“Rising inequality” has become a catch-all explanation with which politicians, journalists, and intellectuals can wave away the actual concerns of “populists,” with abstract talk about the “underlying economic causes” — few if any of which stand up to scrutiny.
The past year has seen a spate of books worrying about the decline of Western liberal democracy. One of the lazy and unexamined assumptions in these books is the idea that “rising inequality” is a causal factor for the current wave of so-called populism witnessed in Europe and America. This cliché is trotted out by writers across the political spectrum. For example, in Why Liberalism Failed, the conservative Patrick J. Deneen points to “a growing gap … between wealthy haves and left-behind have-nots.” In How Democracy Ends, the centre-leftish David Runicman writes, “a driver of populism [is] rising inequality.” Similarly, Edward Luce in The Retreat of Western Liberalism reports in glib and journalistic prose that we live in “times of stark and growing inequality.” The problem with these platitudes is that they bear virtually no relationship to the lived reality of millions of people in the West. I will explain why.
Recent Inequality
In Great Britain, with changes in the type of work people do, and as capital has been reallocated from manufacturing to services, real household income has increased across every wage bracket. According to the Survey of Personal Incomes, families in the 90th percentile were paid 32 percent more in 2017 than they were in 1994. During this period, the bottom 20 percent experienced average annual real growth of between one percent and two percent, figures not matched by most of the rest of the income distribution range, so how can that old canard that “the poor keep getting poorer” possibly be true?
And according to the Institute for Fiscal Studies (IFS), the percentage of the population who are in the absolute low-income bracket reduced from 88 percent in 1961 to 12 percent in 2016, and just under 20 percent after adjusting for housing costs. (Sources for following graphs from IFS here and here). This reflects global trends in which extreme poverty has been reduced across the world and in rich nations.
Long Term Inequality
In discussions about inequality, many seem to consistently forget one of Adam Smith’s greatest insights, which is that wealth is not a measure of the total amount of money one possesses, but a measure of the goods and services to which one has access. As Matt Ridley has shown, the true measure of prosperity is the increase in the amount of goods and services you can earn with the same amount of work. We can see this with a vital human resource such as artificial light as per the table below:
| Year | Technology | Output | Cost in Average Wages |
| 1750BC | Sesame Oil Lamp | 24 lumen-hours | 50 hours |
| 1800 | Tallow Candle | 186 lumen-hours | 6 hours |
| 1880 | Kerosene Lamp | 4,400 lumen-hours | 15 Ends minutes |
| 1950 | Incandescent Lightbulb | 531,000 lumen-hours | 8 seconds |
| 2010 | Compact Fluorescent Lightbulb | 8.4 million lumen-hours | 0.5 seconds |
(Source: Ridley, The Rational Optimist, based on this study).
Between 1800 and 2010, people living in the United Kingdom saw a 43,500-fold improvement in the amount of time it takes to pay for an hour of light on average wages. This is prosperity. Similarly, a 361-mile stage coach journey in 1800 would take 24 hours to travel and one month on average wages to earn, whereas today the same journey in a car would take six hours travel time and four hours and 45 minutes on average wages (£13.94 per hour, assuming it costs around £62 to fill up a tank of petrol). In 1950, it took the average worker around 30 minutes to earn enough to pay for a McDonald’s cheeseburger, today it takes the average worker around three minutes. Taking together these time savings afforded by technologies, which were developed by the free enterprise of individuals working in cooperation through trade, the standard of living in 2018 is many times greater than in 1800 — this fact is not necessarily reflected in income or productivity statistics.
Median income has increased by 80 percent since 1960. The wage of an average full-time worker in 1960 was around £700, adjusted for inflation that is around £15,000 today. The wage of the average full-time worker in the UK today is around £27,000. The average loaf of bread in 1960 was around 99p (in 2018 pounds, adjusted for inflation) while today one can buy a loaf of bread for 55p in any branch of Tesco or Sainsbury’s. Even without calculating the prosperity gained through the myriad time savings afforded by technology between 1960 and 2018 discussed above, the purchasing power of the median worker is still 66 percent higher today than in 1960. Considering that the workforce has almost doubled since 1960 with women entering employment in large numbers, this is somewhat remarkable.
 Matt McManus
These are not just statistics but real people’s lives. To take my own anecdotal example, my grandfather — who I never met — was a Welsh coal miner. I work at a university. My current wage is at least a 270 percent increase on what he would have earned in a year adjusting for inflation. How many people currently in professional, white collar jobs can share similar stories? Polls suggest it must be millions. The share of the population who work in managerial, administrative, clerical, supervisory and professional jobs has increased from less than 25 percent in the late 1960s to more than 50 percent in the 2010s, while the share in manual jobs and unskilled work has decreased from 65 percent to less than half. The grandchildren of coal miners and factory workers, statistically speaking, are more likely to be working in the city for the likes of IBM, Microsoft or Google, or else, like me, in one of the traditional professions.
Devastating as the evidence seems to be to the narrative that we are experiencing “rising inequality,” the mantra keeps being repeated mindlessly. Why? As I argued in an earlier piece for Quillette, it seems likely to me that managerial elites must continuously supply a narrative of “rising inequality,” despite evidence, to create a demand for grievance. More insidiously, their very livelihoods as well as the ultimate source of their power and influence depends on this, regardless of whether the individuals involved in perpetuating these myths are conscious of it. In a recent song, Kanye West rapped: “See that’s the problem with this damn nation; All Blacks gotta be Democrats, man; We ain’t made it off the plantation.” In the UK context, one could just as easily substitute “Blacks” for “Welsh People”, and “Democrats” for “Labour.” Although, in both cases, the opposition parties also supply grievance narratives and subsidies in exchange for votes (an obvious case in America would be farmers who have long received subsidies from the Republicans and, in the UK, as Ms. May soon found out, the elderly who receive innumerable perks from the Conservatives).
Given that politicians of all stripes regularly talk about the “burning injustice” of “rising inequality,” and given how regularly this is repeated by supposedly leading intellectuals, one would think that people would have an acute sense of how money is distributed. It should be surprising then that only 29 percent of over 55,000 respondents from 40 countries can accurately point to the income distribution of their national economies when faced with the choices below as this study found, which is only marginally better than random.
In the UK only 13 percent were able correctly to identify pre-tax and transfer income levels of inequality, and in the US respondents fared even worse at 12 percent. Respondents in the US, UK, Germany, Canada, and Australia all had a margin of error higher than 36 percent. That respondents estimated figures well below both average and median wages demonstrates the extent to which habitual talk of “haves and have nots” fueled by the media is perception.
But even beyond all of this, does data about income distribution tell us anything significant? Percentage brackets of income are ultimately meaningless because they assume that people are static and live out their whole lives in one bracket, whereas most people move between percentile groups with age (see Thomas Sowell’s Applied Economics).
To take myself as an example: in 2006, when I was 24 years old, I would have been in the 80th percentile, now at 35, I am in the 10th percentile. When I retire I’ll go back to being in the bottom 80th percentile, despite the fact I’ll likely have greatly more wealth at the age of 75 than I had at the age of 24. Kevin Williamson notes that in the US, 73 percent of people will find themselves in the top 20 percent at some point in their lives, and 39 percent of people in the top five percent for at least a year. Around 12 percent will find themselves in the top one percent for a year. Here you can see the median weekly wages broken down by age courtesy of the Office of National Statistics.
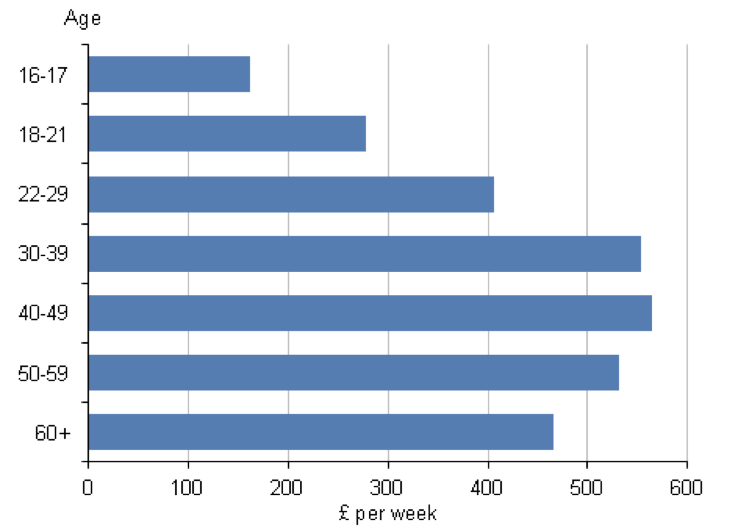
(Source: ONS)
Keep reading
Ireland's Antisemitism Crisis with Rachel Moiselle | Quillette Cetera Episode 68

On the Brink Again

They See Dead People

The Oldest Tradition in Art

The Tobacco Wars

Omer Bartov: What Went Wrong?