After Quillette published an essay by evolutionary biologist Carole Hooven titled, “Why Do Men Dominate Chess?,” a number of friends asked me if her essay explained a similar phenomenon in my own field of mathematics. After all, aren’t many of the traits that Hooven identified as crucial to excellence in chess—innate spatial ability, competitiveness, obsessiveness—similarly crucial for excellence in mathematics? And don’t men dominate mathematics for some of the same reasons?
 Carole Hooven
Hooven states that there does not appear to be much dispute about the size or persistence of sex gaps in chess, and she wonders if biology might play a significant role in men’s domination of the game. Her study was prompted by a ruling from FIDE, the International Chess Federation in Switzerland, stipulating that transgender women may not compete in official FIDE women-only chess tournaments, which often carry substantial financial rewards and recognition. That suggests that men may have some biological advantage in chess. Is this also the case in mathematics?
To quantify what she means by dominance, Hooven reports that “the fair sex accounts for only about two percent of the world’s chess Grandmasters.” But mathematics does not have Grandmasters, and unlike its close scientific field of physics, there are no Nobel prizes in mathematics. Common criteria for distinction in mathematics, such as the number of PhDs or professorships an institution awards, are decided by committees and these are often quite political. On the other hand, there are some clear objective measures in mathematics analogous to chess’s world championships.
The statistics for the very highest levels of mathematics competitions—in age groups ranging from middle school MathCounts to the university-level Putnam Mathematical Competition and the annual International Mathematical Olympiad—suggest that sex statistics in mathematics closely resemble the chess statistics Hooven quoted in her essay. For example, about 95 percent (not all sexes were revealed) of the top-scoring 100 participants in the 2023 International Mathematical Olympiad were male.
Unlike chess, these three competitions are all age-restricted. But mathematics has two additional levels of distinction above world championships and Olympiads, and both are open to all comers. The first is the set of seven Millennium Prize Problems announced in 2000, the solution to each of which carries a prize of a million US dollars. A quarter-century later, only one of these, the Poincaré Conjecture, has been solved, by unemployed Russian mathematician Grigori Perelman, who turned down both the million dollar prize and a Fields Medal.
The very highest level of mathematics challenges and accomplishments, which carry no monetary award at all, is solving one of the famous historical mathematics questions that date back to the ancient Greeks. My personal favourite still-unsolved problem is Goldbach’s 1742 gem: Is every even integer greater than two the sum of two prime numbers? Yes or no?
Solving one of these problems brings the highest recognition among mathematicians, and sometimes even the general public. When Princeton mathematician Andrew Wiles was able to solve Fermat’s 1637 conjecture in 1995 after working on it for nearly eight years, mostly in isolation and in secret, his discovery instantly made international news. The sex statistics for solving these conjectures are as persistent and one-sided as those for chess. For instance, of the roughly two-dozen famous conjectures that have finally been cracked by lone mathematicians in the past fifty years, every one has been solved by a man.

Men’s domination at the highest levels of mathematics is much more contentious than their dominance in championship chess for several reasons. For starters, almost every human being on the planet, whether good at mathematics or not, is forced to learn and use at least some basic arithmetic and algebraic skills in daily life.
Another important difference between chess and mathematics is that mathematics is often both fascinating and useful to the general population. For example, an article by applied mathematician Herman Chernoff titled, “How to Beat the Massachusetts Numbers Game” made instant news, and Benford’s Law is employed internationally to detect financial and voting fraud as well as earthquakes. There are huge numbers of excellent careers at all levels in mathematics—teachers from grade school to graduate school, financial analysts, data scientists, sports statisticians, you name it. But only a handful of Grandmasters make a full-time living playing chess, and no one but dedicated chess aficionados cares about new opening or end-game chess strategies.
Unlike Olympic sports, but like chess, the International Mathematical Olympiad has both an open category that anyone may enter and separate competitions open only to girls or women. The annual open International Mathematical Olympiad is augmented by both a European Girls Mathematical Olympiad and a Chinese Girls Mathematical Olympiad. Although American girls’ teams have won medals, for reasons unexplained there are neither American nor International Girls Mathematical Olympiads at the present time. The renowned Putnam Mathematical Competition is also open to everyone, but instead of an additional women-only division, it has a special award for the highest-scoring female.
Since some of the women-only mathematics prizes also come with high perks—the Birman, Michler, and Street women-only mathematics awards, for example, each award US$50,000—the same question may soon arise in mathematics. Should transgender women be barred from female-only mathematics competitions and awards? Does biology play an important role, not only in tournament-level chess as Hooven suggests, but also at the highest levels of mathematical achievement?
The Greater Male Variability Hypothesis and Its Critics
In making the case for the role biology may play in championship chess, Hooven’s Quillette article did contain one significant error—she dismissed greater male variability (GMV) as a factor. This error does not affect her other arguments, and GMV may in fact provide strong support for why men appear to dominate the upper tiers of both chess and mathematics. Her error, as I will explain below, is a version of a fundamental logical error that continues to plague GMV-related research today.
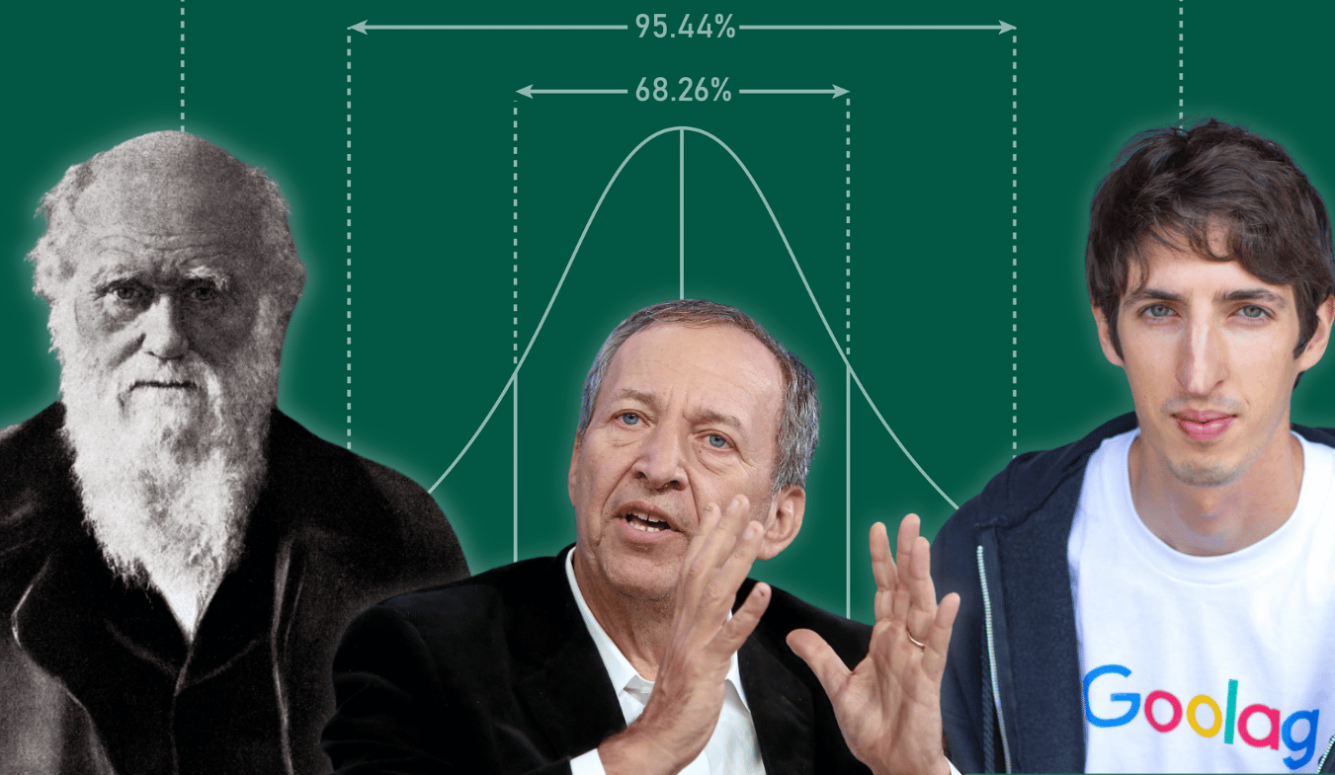
The basic tenet of GMV, which dates back to Charles Darwin’s observation in his 1871 book The Descent of Man, is that throughout the animal kingdom, males generally tend to be more variable than females of the same species. In the highly controversial field of human cognition, for example, GMV has often been interpreted to mean that there are more idiots and more geniuses among men than among women.
Darwin’s questions about sex differences in variability continue to challenge science—over 350 scientific articles on the subject have been published since 2020, and GMV is generally accepted in many contexts. For example, using three different measures for differences in variability (Levene’s test, the variance ratio test, and the distances between cumulative distribution functions), Lehre et al concluded:
The data presented here show that human greater male intrasex variability is not limited to intelligence test scores, and suggest that generally greater intrasex variability among males is a fundamental aspect of the differences between sexes.
Most people do not care about sex differences in blood pressure or birth weight, but the subject of sex differences in human cognitive abilities has been an incendiary topic almost since Darwin’s time. And much of the controversy, as Hooven hints, has related to the role of biology.
In 1992, Stanford education professor Nel Noddings called GMV a “pernicious hypothesis.” It is, she explained, “objectionable because of its biological connotations” and this accounts for “the revulsion with which many feminists react to it.” In their 2018 textbook on the psychology of women and gender, professors of women’s and gender studies Nicole Else-Quest and Janet Hyde take Noddings’s observation a step further. “Many feminists,” they write, “are wary of biological explanations of anything, in large part because biology always seems to end up being a convenient justification for perpetuating the status quo.”
But in a curious turn of events (and an even more curious turn of logic), Darwin’s biological conception of GMV is now being used to argue that the persistent overrepresentation of men in fields like mathematics is mainly due to cultural effects, including what Hooven calls “sexism and harassment.” Many prevailing GMV arguments, however, suffer from fundamental logical errors. The current scientific definition of GMV is that there is GMV for a given trait if—and only if—the standard deviation for the male values of that trait is larger than the standard deviation for the female values of that same trait. This definition says absolutely nothing about comparisons between the averages or high or low values of the male and female distributions.
The current scientific definition of GMV is that there is GMV for a given trait if—and only if—the standard deviation for the male values of that trait is larger than the standard deviation for the female values of that same trait.
Informally, GMV is usually understood to mean that the male values are more spread out than the female values for that trait, but there are many different statistical measures of how “spread out” a distribution or data set is. The range of the data set, for example, is simply the difference between the maximum and minimum values of the data. Other statistics such as mean (or average value) and median are generally well understood by the general public and used more or less correctly in everyday language. But standard deviation is a different matter.
At the end of the semester in my upper-division calculus-based probability courses at Georgia Tech, I was happy if my students could correctly define “standard deviation.” Care to give it a try? The standard deviation of a data set is “the non-negative square root of the average of the square of the distance from the data's mean value.” In practice, of course, researchers simply plug their data into a statistical package that spits out the correct numerical values of the standard deviations, which in plain English measures the spread of a data set relative to its mean.
Thus, the current formal working scientific definition of whether or not there is greater male or greater female variability for a given trait—such as height or blood pressure or mathematics ability—depends solely on whether the male or female standard deviation for those trait values is larger.
Three Common GMV Errors
In understanding the GMV hypothesis, we first have to clear up some common misunderstandings:
- The Uniformity Error: Just because there’s GMV in a whole population doesn’t mean it exists in every subgroup.
- The Cause-and-Correlation Error: GMV doesn’t tell us anything about why the variability exists. It could be due to biological factors, social factors, or a mix of both.
- The Tail-Ratio Error: GMV doesn’t automatically mean there will be more males at the extreme high (or low) end of a trait.
The Uniformity Error
The uniformity error is the mistaken assumption that if the distribution of a certain trait exhibits GMV for a population as a whole, then the individuals in various subpopulations must also exhibit GMV for that trait. This is simply not true. Consider a data set with equal numbers of males and females, where the men’s values are all tightly clustered in two equal-sized groups of high and low values, and the female values are uniformly distributed between those same high and low values. Clearly there is GMV for this trait, but among the above-average values alone, there is greater female variability.
Hooven’s inquiry into why men dominate the highest levels of chess commits the uniformity error by dismissing GMV as a possible factor, because even though there appears to be GMV in the overall population of world-class chess players, some subgroups actually exhibit greater female variability (GFV). But GMV in chess abilities cannot be ruled out simply because of this non-uniformity. In fact, GMV could be a very significant explanation of why nearly all Grandmasters are men.
The Causation and Correlation Error
A second basic error in GMV arguments is a variant of the common causation and correlation error that has plagued the study of statistics since its inception. Whether or not a data set of a certain trait among males and females exhibits GMV or GFV implies nothing at all about the causes of the sex differences in the variability. A moment’s reflection tells us that this is true even for a single data set. If we learn that the standard deviation of the height of men in Canada is 2.7 cm, that is all we know—not anything about the underlying reasons for this magnitude of standard deviation. Similarly, since GMV and GFV simply record comparisons of the two respective standard deviations, they reveal absolutely nothing about the underlying causes of any differences between the male and female standard deviations for that trait.
The Tail Ratio Error
The third common logical fallacy in GMV arguments is what I will call the tail ratio error. Without additional knowledge about the actual distribution of the trait values in question, neither GMV nor GFV imply anything about sex comparisons in the extreme values of that trait. Suppose, for example, that the female values for a given trait are all high and tightly clustered, and those for men are all lower but widely dispersed. In this case, there is clearly GMV for that trait, but females are all at the top, and the ratio of females to males in that upper tail region is high. On the other hand, if the male values are again more widely dispersed but are uniformly higher than the female values, there is again GMV but the ratio of men to women among the highest values is high. Thus GMV or GFV alone implies absolutely nothing about the tail ratios for that trait, including the dominance of either sex in chess or mathematics or any other trait.
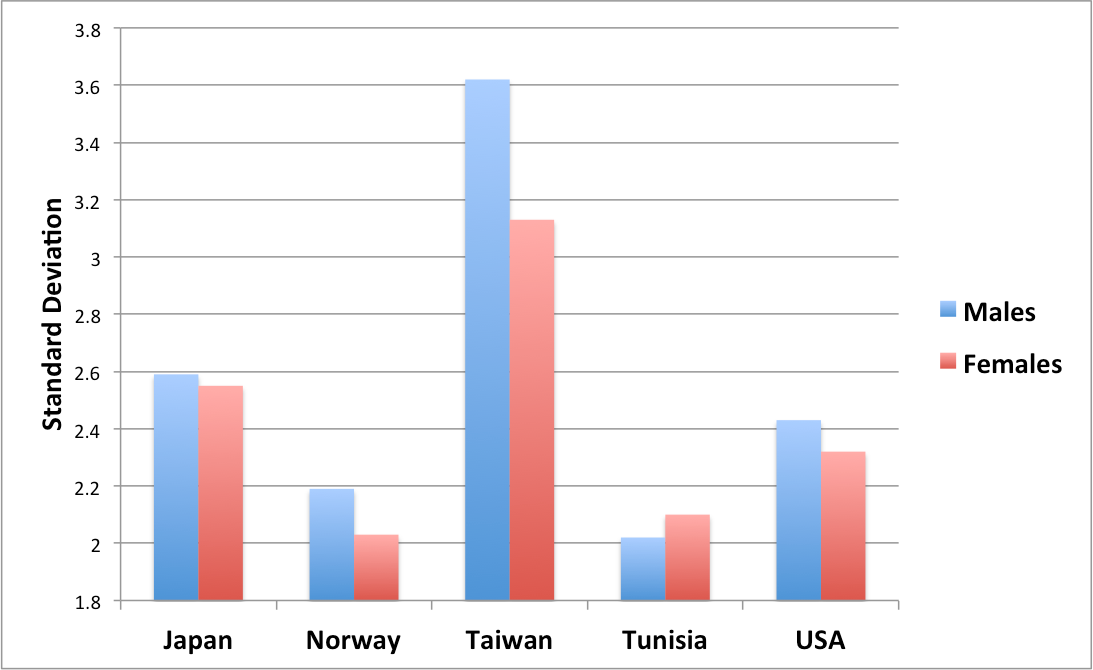
A simple example with real data may help clarify these three errors. This bar graph data is from mathematical performance tests of middle school children internationally. First, the non-uniformity of the male/female variability in these countries, which exhibit both GMV and GFV, does not rule out GMV globally, and suggesting otherwise is committing the uniformity error. In fact this study found that there is indeed GMV in the worldwide test scores. Second, inferring causes for the GMV in Norway and the GFV in Tunisia solely from these differences in variability is committing the causation and correlation error. The fact that male or female standard deviation is greater in a country gives absolutely no clue as to the underlying reasons for these differences. Third, neither GMV nor GFV alone, without additional information about the distributions, implies anything about extreme values. For example with these same standard deviations, 95 percent of the top 1 percent of Norwegians’ scores could be males (e.g., if the average score for males is 100 and the average for females is 50), or 95 percent of the top 1 percent could be females (if the female average score is 100 and that of males is 50). Thus drawing any conclusions about the over- or under-representation of either sex in the extreme values, based solely on these differences in variability, is committing the tail ratio error.
Unfortunately, a widely cited and influential article published over a decade ago in Notices of the American Mathematical Society (“the world’s most widely read journal aimed at professional mathematicians”) contained all three of these errors. That article, by a husband and wife team of professors at the University of Wisconsin, committed the tail ratio error by claiming that if GMV were true for mathematics ability, it would explain why all Fields Medalists (one of the highest prizes in mathematics) had been male (at the time of the article’s publication). It then committed the uniformity error by claiming that if GMV were true internationally, then it would hold for each individual country. Since every individual country did not exhibit GMV in mathematics ability, they conclude that this variability in relative standard deviations debunks the greater male variability hypothesis altogether. This supposed debunking of GMV, they then argued (committing the cause and correlation error), implied that those sex differences were therefore an artefact of “a complex variety of sociocultural factors rather than intrinsic differences,” i.e., cultural factors as opposed to “innate, biologically determined differences between the sexes.”
These same basic GMV errors are being widely propagated in both research and popular-science journals today, including national news outlets. Science—the peer-reviewed academic journal of the American Association for the Advancement of Science and one of the world’s top academic journals—reported on this research in an article titled, “It Doesn’t Add Up.” It, too, claimed that this “cross-cultural analysis” of GMV in mathematics ability in various nations “seems to rule out several causal candidates, including ... innate variability among boys” and that this points to “local social factors as the likely primary culprit. Gender gaps vary from place to place, showing that cultural factors swamp biological ones.”
Scientific American referred to the same study and concluded, “Now that the greater male variability hypothesis has fallen short, nature is not looking as important as scientists once thought.” Biology, the author added, “may play only a minor role in the math gender gap.” As NBC News reported it, this GMV research showed that “the ‘Gender math gap’ is cultural, not biological.”
Similarly, a research article in the Proceedings of the National Academy of Arts and Sciences reported that, with respect to mathematics, GMV “is largely an artifact of changeable sociocultural factors, not immutable, innate biological differences between the sexes.” The science website PhysOrg, reporting on similar published GMV research conducted at the Australian National University, reported that, “Deeply entrenched scientific beliefs that for more than a century have explained why more men than women are high achievers because of biology are not backed up by evidence.” The headline of that article? “Sexist ‘Sexplanation’ for Men’s Brilliance Debunked.”
It is exactly these misconceptions about GMV that have continued to make it inflammatory. For suggesting that GMV might be a contributing factor to the under-representation of women in physics and mathematics departments at top universities, Harvard president Larry Summers was forced to resign in 2005, even though he had simply—and correctly—observed that the standard deviation of men in several traits, including mathematics ability, is larger than the standard deviation of women. A similar viewpoint about GMV in high-tech fields led to the firing of Google engineer James Damore in 2017.

In a 2017 essay for Quillette, I detailed the harassment my colleagues and I experienced after we suggested a possible mathematical theory for GMV. In response, an official blog of the American Mathematical Society, of which I have been a member for fifty years, called my evolutionary theory for GMV “sexist,” and fraught with “bad math” and “full-blown gloves-off misogyny.”
Theodore P. Hill
By trying to help set the scientific record straight and put a stop to the propagation of these errors, cognitive psychologist Rosalind Arden and I recently wrote to the Notices, and offered to help identify and correct the basic errors about GMV that were being repeated. But after the Notices’ editor-in-chief consulted her editorial board several times, she decided not to publish any conceivable version of the paper (shorter, gentler, whatever), even as an editor’s note alerting readers to the errors. She declined to provide any reasons or explanation for the blanket rejection, and suggested that we publish it elsewhere, which we did just last year.
Bell Curves and Extreme Tails
As we have seen, whether or not a data set exhibits GMV or GFV implies absolutely nothing about the tail ratio of men to women above (or below) a given cutoff. Tail ratios are among the most common and important statistics used to compare extreme values between two data sets. In Hooven’s analysis, for example, she reports that about two percent of chess Grandmasters are women—so, the male-to-female tail ratio among chess Grandmasters is 50:1.
There is much less interest in how the average chess player or mathematician of each sex compare; the emphasis is usually on comparisons between top performers. However, comparisons of only the standard deviations of the two data sets, i.e. GMV or GFV, imply absolutely nothing about the extreme values and, in particular, the tail ratios. In fact, GMV alone could easily explain the persistent sex gap in chess and mathematics if those abilities are normally distributed.
In common explanations of the GMV and its implications for disproportionate levels of representation in various realms, authors often include graphs of two bell-shaped curves with different degrees of spread. These graphs are invariably of what is called the normal (or Gaussian) distribution, after mathematician Carl Friedrich Gauss, who discovered it in 1809 during his experiments with celestial observations.
The normal distribution is by far the most prevalent distribution in biometric studies, and like Darwin’s GMV hypothesis, Gauss’s normal distribution bell curve has also been the epicentre of heated controversies, especially with regard to biological applications. When political scientist Charles Murray, one of the authors of The Bell Curve, was invited to speak at Middlebury College in 2017, student protests not only disrupted his speech but also injured a faculty member, drawing national media attention.
One of the reasons for this prevalence of the normal bell curve in real-life data is that it is the consequence of one of the most powerful and beautiful theorems in statistics, the Central Limit Theorem, which states that if you repeat any experiment independently many times, the distribution of the sample average converges to the normal distribution bell curve. Not to some other shape, nor even to one of the other bell curve distributions.
An ingenious simple experiment devised by British polymath Francis Galton in the late nineteenth century, and still popular in science museums and classrooms today, yields a fascinating visual demonstration of this convergence to the normal distribution bell curve. May human traits have been found to be essentially normally distributed, including blood pressure, birth weight, and Scholastic Aptitude Test (SAT) scores in mathematics.
Normal distributions have a special property concerning tail ratios. Georgia Tech physicist Ron Fox and I recently discovered an extreme tails property for normal distributions that is apparently not well-known. In every collection of different normal distributions, there will always be exactly one of those distributions that is not only over-represented in the right tail but also completely overwhelms all of the other distributions in the rightmost tails. Additionally, exactly one distribution—possibly the same one—will overwhelm all the others in the lowest values. Of course, at what point the sex gap first appears is dependent on the parameters of the corresponding bell curves.
If the normal distribution of traits in one sex has a higher standard deviation than that in the other, that sex will completely overwhelm both the upper and lower tails.
If the normal distribution of traits in one sex has a higher standard deviation than that in the other, that sex will completely overwhelm both the upper and lower tails. For example, since SAT scores in mathematics are distributed normally, and males have a larger standard deviation, they dominate both the high and low ends of the curve. Whether or not chess ability is also normally distributed is not known, since there is only data for the highest level of players. This may soon change, since Armenia recently required every pupil in the country between the ages of six and eight to learn chess in school, and it is quite possible that boys are also over-represented among the worst players, just as they are in mathematics.
If both sex distributions are normal and have exactly the same standard deviation, on the other hand, then the one with the higher mean will completely overwhelm the upper tail, and the one with the lower mean will completely overwhelm the lower tail. This extreme tails property, although not unique to normal distributions, is not shared by other common distributions, even by other common bell-shaped distributions.
A concrete example may help to clarify this extreme tail property for normal distributions. It has been reported that the blood pressures of humans are essentially normally distributed, and that males have an average value of 124.7 and a standard deviation of 14.5, while females have an average of 125.7 and a standard deviation of 10.4. A standard statistical calculation then yields that there are a few more males than females with blood pressure of 130 or higher, i.e. the M/F tail ratio at 130 is slightly greater than 1:1. The M/F tail ratio above 140 is about 2:1, at 150 about 5:1, and 160 about 20:1. So, even though men have, on average, lower blood pressures than women, men overwhelm women at the high values, and the tail ratio gets worse the higher one goes. An example of this in the mathematical context can be seen by looking at the SAT scores in mathematics where the M/F tail ratios are increasing, both as the scores get higher and as they get lower.
Summarising the key GMV and bell-curve points here, there are three important takeaways:
- Without any additional information about the underlying distributions of the trait and species under study, whether or not there is GMV or GFV says absolutely nothing about the causes of any sex differences in that trait. Nothing about biology or culture or anything else.
- Without additional information about the underlying distributions, neither GMV nor GFV says anything about the comparative extreme values. There could be greater male variability while females completely dominate the top end, and vice versa.
- If two different sex distributions are normally distributed, then one of those two sexes will completely overwhelm the other at the high end of values, and another, possibly the same, will overwhelm at the low values.
Harvard president Summers and Google engineer Damore might therefore both have avoided defenestration had they simply announced that mathematics and engineering abilities essentially follow a normal distribution, and left the identification of the dominant sexes in each case to the bureaucratic bean-counters.
Charles Darwin might have been intrigued had he foreseen that, a century and a half later, his observation about generally greater male variability throughout the animal kingdom, including humans, would still be extensively studied and cited. But he might also have been bewildered to learn that his own biological hypothesis would be incorrectly invoked to argue that the over-representation of males in many fields like chess and mathematics is primarily not due to biological causes.
Keep reading
AI Is Not About To Become Sentient

The Innovation Trap

Treating Myths as Science

The Edifice Complex

Letters to the Editor

Criminal Research