Finance
The Risk of Inflation
Consumer price inflation is a broad rise in prices of everyday goods, and is often driven by a notable increase in the broad money supply combined with limitations in key supply chains and scarcity of essential commodities.

Several prominent investors have been voicing concerns lately over the potential for return of consumer price inflation sometime over the next several years, with the latest commentator being Michael Burry of The Big Short fame. While inflation is by no means assured this decade, the risk factors for it are rising. It’s worth being aware of the history of inflation in the United States and what may cause it in the years ahead.
Consumer price inflation is a broad rise in prices of everyday goods, and is often driven by a notable increase in the broad money supply combined with limitations in key supply chains and scarcity of essential commodities.
* * *
For this article, it helps to define two types of money. The first type is the broad money supply, which refers to the national sum of physical currency in circulation, checking accounts, savings accounts, certificates of deposit, and similar cash-equivalents. For the United States, this figure is approximately $19.5 trillion. The second type of money is the monetary base, or base money, which refers to physical currency in circulation and bank reserves. This narrower figure is approximately $5.3 trillion.
Base money can be thought of as the foundation of the system; it’s the physical money in the economy and the digital cash that banks hold in deposit at the Federal Reserve. Broad money, on the other hand, is what you and I intuitively consider to be our money, and is what primarily gets spent around the economy. Broad money is a much larger figure due to the fractional reserve banking system having multiplied the base money that is available, via its lending activities. Between the two types, changes in broad money have much more impact on inflation than changes in base money.
The past few decades have enjoyed relatively low inflation by official metrics throughout the developed world, although the types of inflation have been uneven. High private debt levels, aging demographics, and sluggish economic growth have been deflationary forces. The trend of offshoring the manufacturing base, along with increased usage of technology that improves efficiency, have also been key contributors to keeping inflation at bay. As a result, things like electronics, commodities, and apparel have decreased markedly in price, while many service-oriented costs like healthcare, childcare, and education have continued to rise notably.
Over the past century, there have only been two broadly inflationary decades in the United States: the 1940s and the 1970s. This chart shows the five-year rolling average percentage growth of US broad money supply per capita and consumer price inflation over the past century:
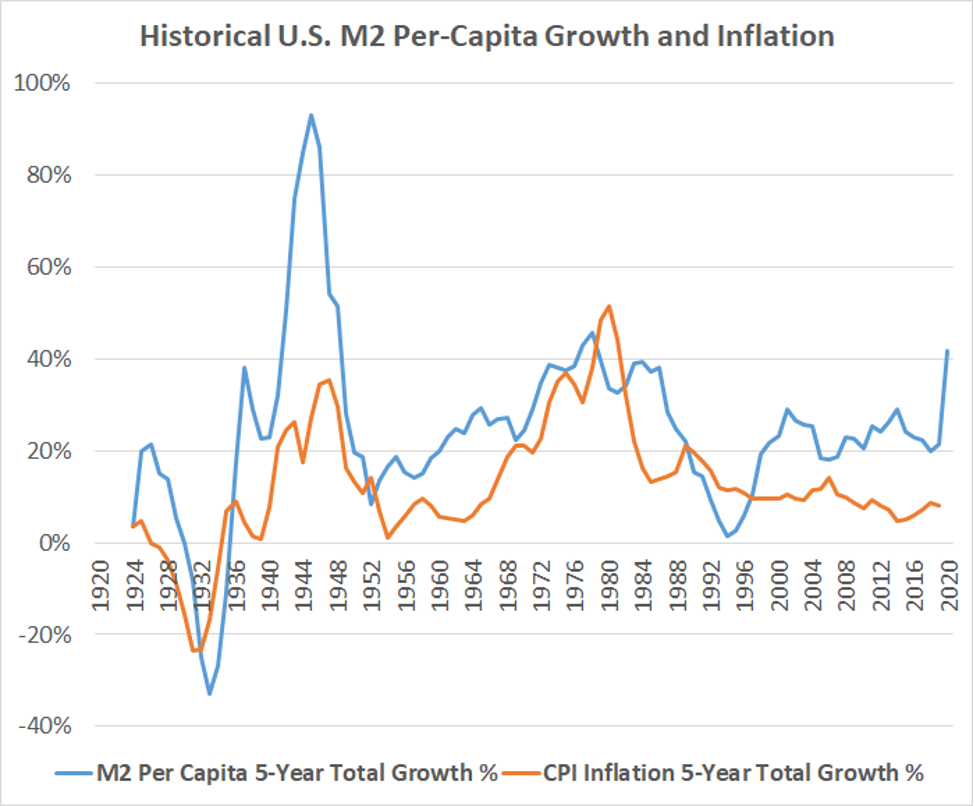
In the 1970s, public and private debt levels were low as a percentage of GDP, but fiscal deficits were moderately high as the United States increased domestic spending and fought the war in Vietnam. The United States had recently gone off the gold standard, and along with oil shortages and other issues, dollars and other currencies rapidly fell in value vs commodities and broad goods.
The 1940s period is perhaps a closer example to our current situation. After a long period of economic stagnation, trade wars, and increased angst between and within countries through the 1930s, the catalyst of World War II caused the United States government to run massive fiscal deficits as a percentage of GDP in the 1940s. A large portion of the Treasury bonds issued to finance this effort were bought by the Federal Reserve with newly-created base money, and so this caused an unusually rapid increase in the broad money supply. With a rapid build-out of the domestic industrial base along with scarcity of various commodities, inflation roared.
This chart shows US fiscal deficits as a percentage of GDP, the short-term interest rate, and the monetary base as a percentage of GDP over the past century:
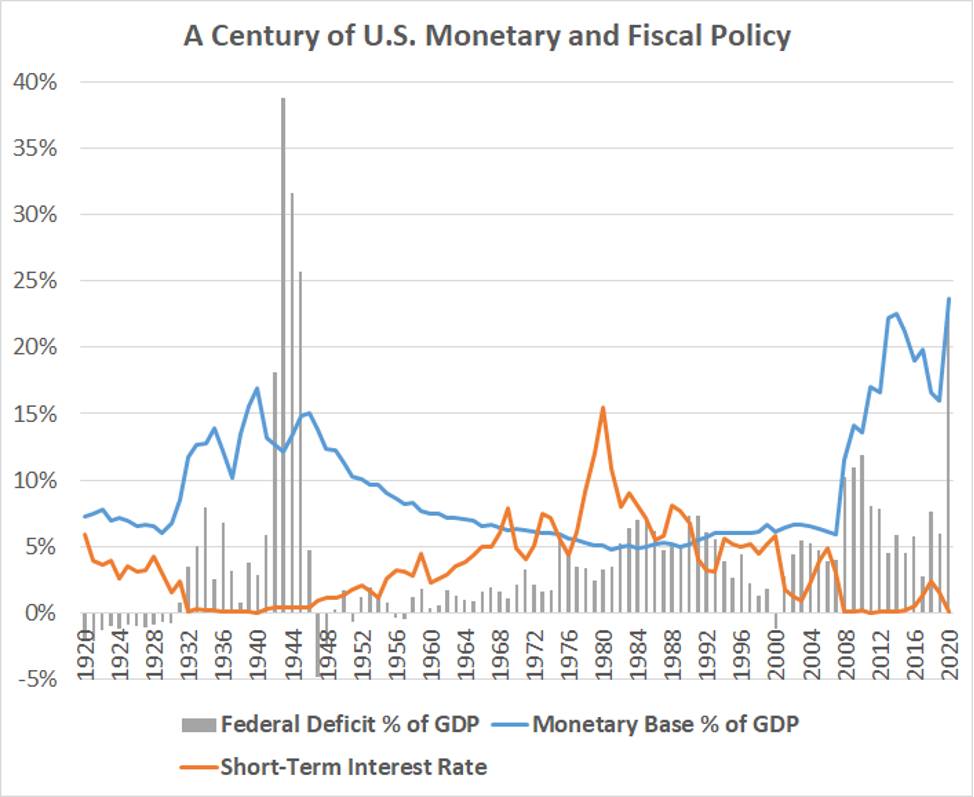
As the chart shows, the fiscal and monetary policy mix we have today is similar to what the country had in the 1940s, and the 2010s were similar to the 1930s. High debt levels, rising populism, and an external threat in the form of a pandemic (rather than war) make for additional similarities.
The United States came into the pandemic with an existing fiscal deficit of about five percent of GDP, which is larger than it normally is during economic expansions. In the response to the pandemic during 2020, fiscal deficits kicked into high gear, the monetary base expanded, and broad money supply rose 25 percent year-over-year, which was the largest annual increase since the 1940s. With further rounds of fiscal aid ahead of us, along with the Federal Reserve creating new base money to buy a significant chunk of the Treasuries issued to fund these efforts, the broad money supply looks set to rise another 10–15 percent or more in 2021 as well.
While it may not light the fire, this policy mix is at least starting to provide dry tinder for a spark of inflation to take hold. Policymakers are aware of this, and are choosing to risk erring on the side of doing too much rather than not doing enough.
If we add some sparks to that tinder, such as semiconductor shortages and other supply chain issues, a relative lack of commodity capital expenditures in recent years, and an increased political will to re-shore some of our manufacturing base, the odds slant still further towards the prospect of inflation in the years ahead.
* * *
An analogy I’ve used for money-printing is to compare the process to nuclear keys, like how two commanding officers are required to provide their nuclear keys in order to perform an authorized launch.
The Federal Reserve can create new base money, but doesn’t have a mechanism to spend it into the real economy. The Treasury, on the other hand, can spend money on behalf of Congress, but has to issue bonds to do it, which sucks money out from somewhere else in the economy. In other words, the Treasury mostly just moves money around. This division of powers between the federal government and the central bank is what keeps the money supply relatively stable during most times in history, and leaves money creation mostly to the commercial bank system.
However, the combination of the Treasury and Federal Reserve working in concert results in a sharp rise in the broad money supply. With this approach, the Treasury spends money into the economy at a massive scale, and the bonds that are issued to pay for it are bought by the Federal Reserve with brand new base money, resulting in outright broad money creation. This close collaboration between the Treasury and the Federal Reserve occurred in the 1940s, and began occurring again in 2020.
Back during the 2008–2014 fiscal and monetary response to subprime mortgage crisis, many investors also warned about inflation, which never materialized. However, in many ways what is happening this time around is the opposite of what happened back then.
This chart shows the year-over-year change, measured in billions of dollars, for base money (blue), broad money (red) and government transfer payments (green):
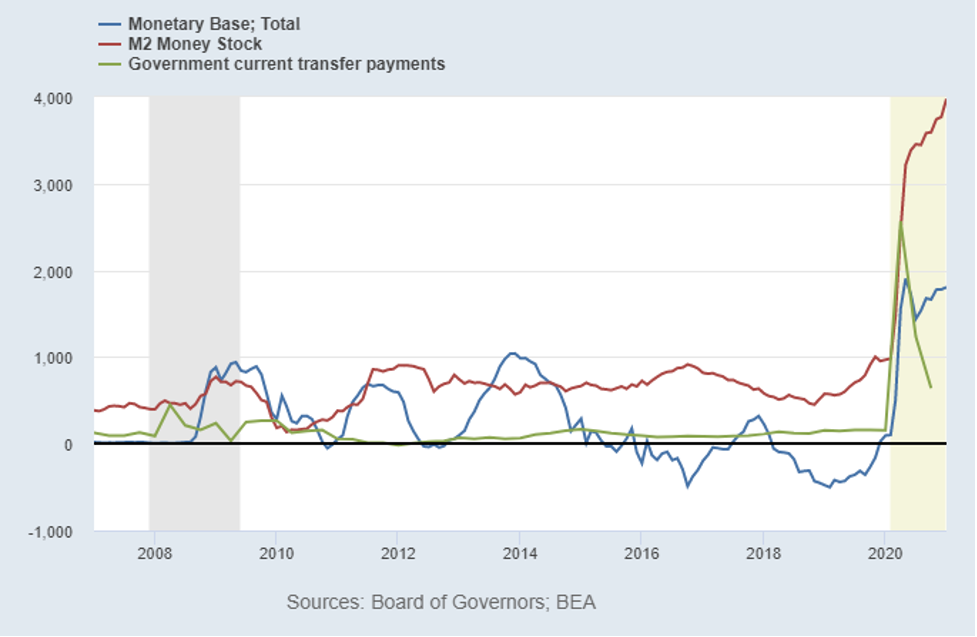
During the subprime mortgage crisis, the Federal Reserve rapidly expanded the monetary base, but the Treasury’s response was more modest. If we continue with the nuclear key analogy for money-printing, only the Federal Reserve’s key was used. The Treasury did not use their key back then; little money was handed out to the broad economy.
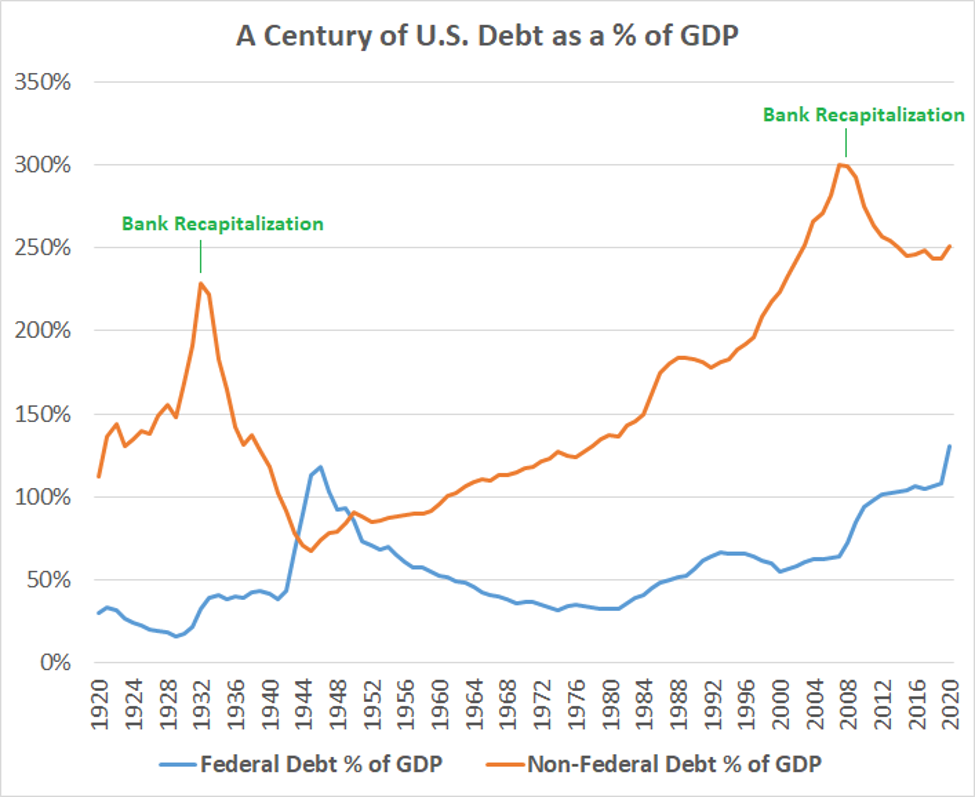
The subprime crisis was a collapse of a long-term private debt bubble, which was similar to the early 1930s. Because the US government is monetarily sovereign (meaning it is the issuer of currency), it is important to separate federal debt and non-federal debt when analyzing the nation’s finances, since they have very different economic impacts.
Here are those debt levels as a percentage of GDP over the past century:
Keep reading
Capturing the ‘Odyssey’
Biting the Hand

Sex Differences Above the Neck

A Beautiful Odyssey, Made Dreary By Remorse