Science / Tech
The Great Statistical Schism
In the early 20th century, this led to a split in the field of statistics, with intense debates taking place about whose methods and ways of thinking were better.
What is probability? This sounds like a discussion question for a philosophy class, one of those questions that’s fun to think about but that doesn’t have many practical consequences. Surprisingly, this is not the case. As it turns out, different answers to this question lead to completely different views of how to do statistics and data analysis in practice. In the early 20th century, this led to a split in the field of statistics, with intense debates taking place about whose methods and ways of thinking were better. Unfortunately, the wrong side won the debate and their ideas still dominate mainstream statistics, a situation which has exacerbated the reproducibility crises affecting science today [1].
Here’s a common, standard statistical inference problem. An old drug successfully treats 70% of patients. To test a new drug, researchers give it to 100 patients, 83 of whom recover. Based on this evidence, how certain should we be that the new drug is worse than, identical to, or better than the old one?
 Elliot Leavy
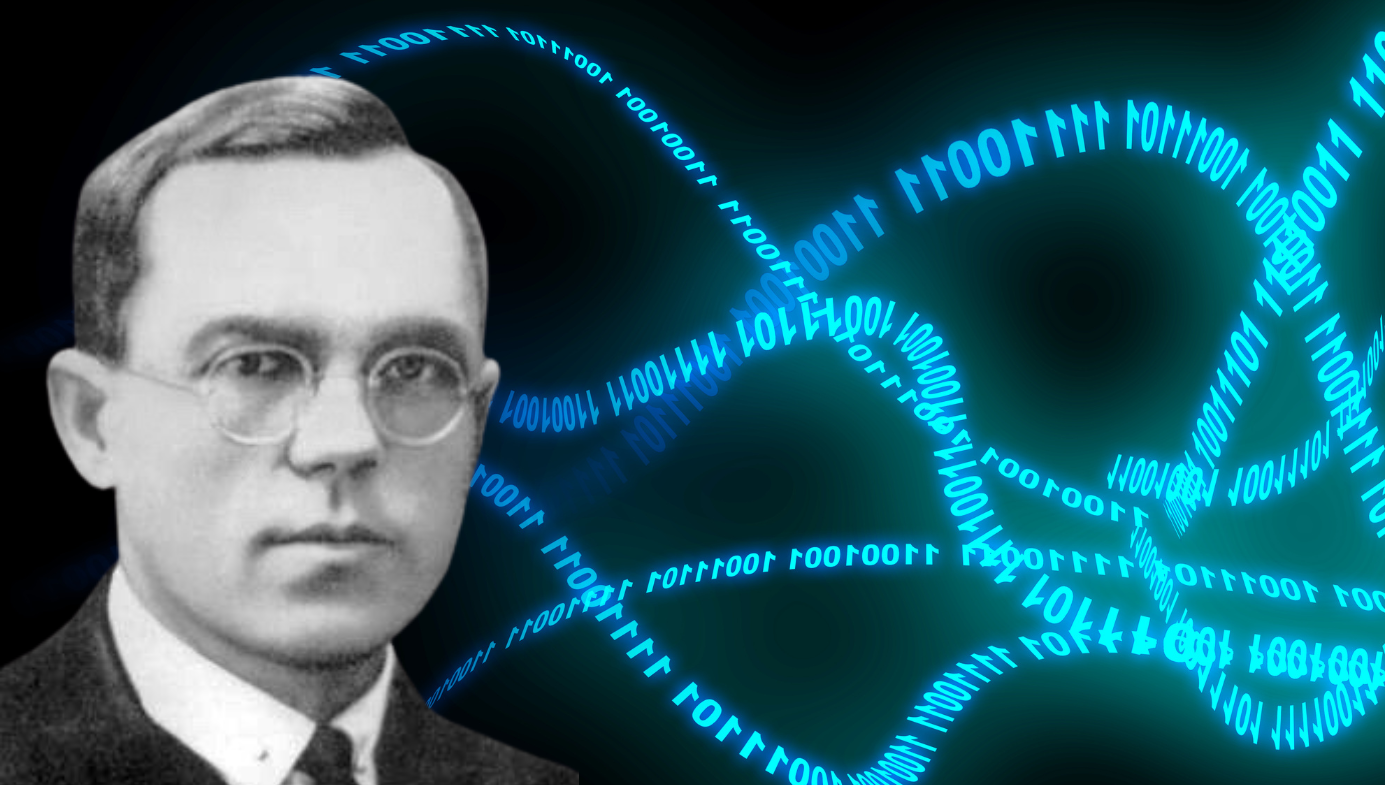
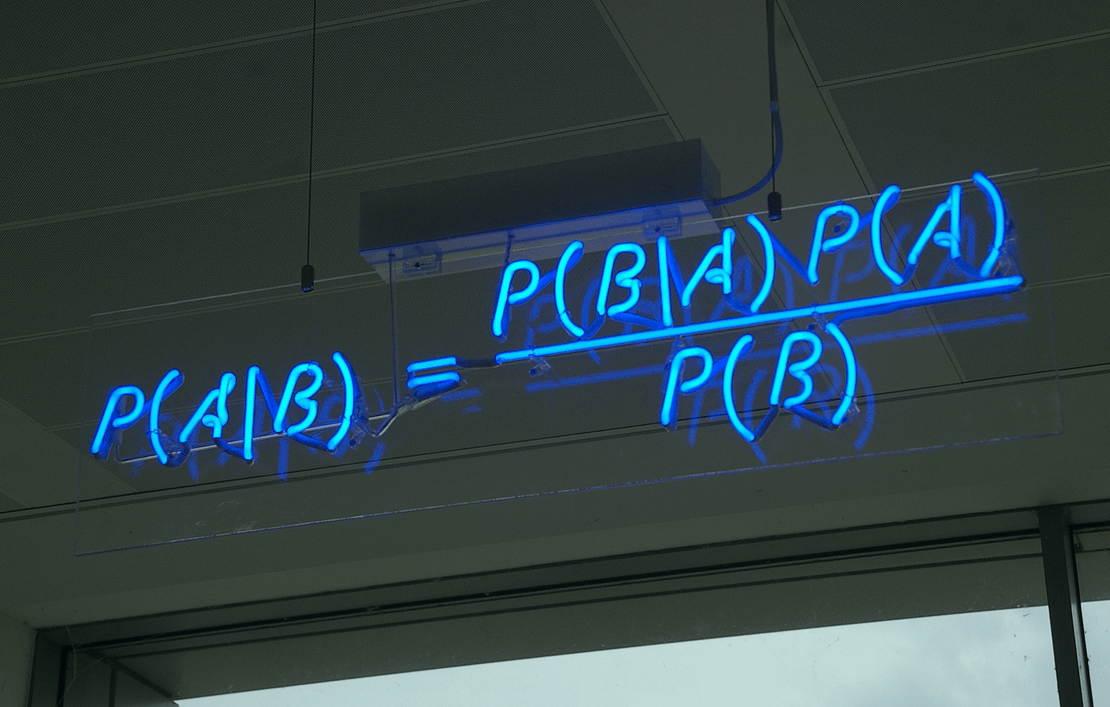
If you think it is legitimate to use the mathematics of probability theory to study the concept of plausibility, you are a ‘Bayesian’ (after Reverend Thomas Bayes, one of the first people to use probability this way). Faced with this question, your job is to use probability theory to calculate how plausible it is that the new drug is much worse, slightly worse, identical to, slightly better, or much better than the old one, taking into account the result of the experiment. The answer you get depends on both the experimental result itself, as well as what you assume about how plausible all of those hypotheses were before you knew the result of the experiment — the dreaded ‘prior’. Under standard assumptions the ‘posterior’ probability the new drug is better than the old one is 0.89, the probability it’s the same is 0.11 (starting from a prior of 0.5), and the probability it’s worse is practically zero.
To a ‘frequentist’, there’s only one legitimate application of probabilities to the real world: to relative frequencies or proportions (plausibility is off limits because it’s too vague to be subject to concrete mathematical rules). Think of the joke “84% of statistics are made up”. It is true that probability theory works here. But can we apply this to the drug example? We can, but it requires some imagination. The standard method is to imagine repeating the experiment many times. If we did this, the number of patients who recovered would not be 83 every single time. Sometimes we’d just happen to get more patients who recover (for whatever reason) and sometimes we’d get less. Interestingly, by ‘repeating the experiment’ we actually mean ‘repeating a similar experiment’ — nobody has the power to repeat anything down to every detail. With this concept of repetitions, we can talk about what fraction of the time a certain experimental result would be observed. If our observed result is unusual under the assumption of some hypothesis, we have evidence against that hypothesis. We just need to figure out how to quantify how unusual our result is.
For example, consider the ‘null’ hypothesis that the new drug has exactly the same effectiveness as the old drug. Then, under standard assumptions we’d typically observe about 70 or so of the patients recovering. The fraction of the time we’d observe 83 recoveries (our actual result) is 0.0012. This number is pretty small, and in general, any actual experimental result is so specific it would hardly ever be observed again. Therefore, 0.0012 can’t be a good way of quantifying how unusual our result is. To “solve” this problem, the influential mathematical biologist R. A. Fisher suggested calculating the fraction of the time we would see our exact result or one that’s even more different from what the null hypothesis would predict. In our case, we need the fraction of the time we’d see 83 or more, or 57 or less recoveries, which is 0.006. This quantity is called a p-value. An oft-criticised convention is that a p-value less than 0.05 implies evidence against the null hypothesis, and our result of 0.006 certainly qualifies as such.
Look at the numbers produced by the two different methods. The frequentist p-value of 0.006 is much lower than the probability the new drug is the same, 0.11. The two quantities are defined and calculated differently, so of course they’re different. But look how big the difference is. Doesn’t 0.006 just feel more compelling? It’s 6 out of 1000 so close to zero! The Bayesian probability of 0.11 (that the drugs are the same) is a much more moderate number. It’s quite common for the frequentist’s p-value to be much closer to zero than the Bayesian’s posterior probability. So any time you see a scientific paper claiming a result with p < 0.05, this is nothing like 95% certainty that the result is real.
This is one reason why so many experimental results aren’t being reproduced; the evidence for them was never strong anyway. In fact many studies reporting p < 0.05 may actually have found evidence in favour of the null hypothesis, meaning a “failed” replication attempt is actually a success!
Good statisticians know that p-values and posterior probabilities are not the same thing, and try to impress it upon their students and scientific colleagues, often without much success. However, a simpler solution exists. If we want to know the plausibility of a hypothesis, why don’t we just calculate it? If you want to know X , calculate X . Don’t calculate Y instead, try to use it for insight about X , and then complain about all the people interpreting Y as if it were X . It’s not their fault.
Robert C. Thornett
The main criticism of Bayesian methods is that they’re subjective; the results depend not just on the data being analysed but also on the other ingredients you must supply, the prior probabilities (how plausible were your hypotheses before taking into account the data?). It’s true these extra assumptions are needed, but this is just accepting reality. For example, if we had assumed the new drug’s effectiveness is probably extremely close to that of the old drug, the data would have been uninformative about the question of “equal or not”, and the posterior probability would have equalled the prior probability. This is not a problem. It is logic.
Things have improved markedly for Bayesian statisticians over the last few decades. These days, you’re unlikely to encounter any hostility by doing a Bayesian analysis. Pragmatism is the most popular attitude. It’s possible to do interesting and useful analyses using tools arising from frequentist thinking, Bayesian thinking, creative invention, or a mixture of all of these, and most statisticians are happy to do so.
One downside of this ecumenicalism is a reluctance to ask fundamental questions: having a strong opinion on this matter has gone out of fashion. Who’s to say one statistical philosophy is better than another? Aren’t all statistical philosophies equally valid paths to good data analysis? Frequentism is “true for me”. As in religion, so in statistics. If you criticise a colleague for using p-values when posterior probabilities are clearly more appropriate, it will lead to accusations of being a ‘zealot’ [2] who should stop ‘crusading’.
A year ago I went to a talk by prominent ‘skeptic’ Steven Novella, in which he advocated for a Bayesian approach to judging the plausibility of medical hypotheses. During the question and answer session, a statistics department colleague of mine raised his hand and said Bayesian statistics was ‘bullshit’ because degrees of plausibility are not empirically measurable. I disagree strongly, but it was refreshing to see someone willing to argue for a view.
Another, more consequential downside is a reluctance to abandon bad ideas. Frequentist confidence intervals and p-values should still be taught to some extent; since so much research is based on them, our students need to know what they are. Other ideas that arose from frequentism, such as maximum likelihood estimation and the notion of ‘bias’, are still useful for obtaining fast approximate results and for computational algorithms respectively. In some difficult research problems they might help if a Bayesian solution is too mathematically or computationally difficult to obtain.
Keep reading
In Bad Faith

Letters to the Editor

Dangerous Liaisons and the #MeToo Wars

The Crisis in the Humanities Is Not About Money

How Brexit Made Britain European