COVID-19
COVID-19's Death Toll: A Historical Perspective
The UK’s Office for National Statistics (ONS) has reported the age-standardised mortality rate in England each year going back to 2001.
Since the COVID-19 pandemic began, public discussion of the virus’s lethality has focussed on two metrics: the infection fatality rate (the percentage of those who become infected that go on to die), and the absolute number of deaths attributable to COVID-19.
The latter quantity has been estimated in two different ways: (1) the number of deaths in which COVID-19 was a plausible contributing factor (“confirmed deaths”), and (2) the number of all-cause deaths in excess of the average over the last five years (“excess deaths”). Governments typically report confirmed deaths on the basis of whether the deceased recently tested positive for COVID-19, or whether COVID-19 is mentioned on the death certificate. Many national health authorities also report data on excess deaths, much of which is compiled on the Our World in Data website.
There may be a significant discrepancy between confirmed deaths and excess deaths. If a country lacks testing infrastructure or many people die without being properly diagnosed, confirmed deaths are likely to be lower than excess deaths (false negatives). By contrast, if many people who die of other causes happen to test positive for COVID-19, confirmed deaths will be greater than excess deaths (false positives). Due to the difficulty of establishing whether someone died of or merely with the disease, excess deaths is generally the preferred measure.
But excess deaths is still not an ideal measure of COVID-19’s lethality. As a nation’s population gets older—as in most Western countries—the absolute number of people at risk of dying each year goes up, even without a pandemic. (In England and Wales, the number of people aged 70 or older increased by 13 percent between 2015 and 2019.) As a consequence, the average number of deaths over the last five years tends to underestimate the expected number who will die—again, even without a pandemic. In addition, since people who die from COVID-19 tend to be slightly older than those dying of other causes, each COVID-19 death is, on average, associated with fewer life-years lost.
Due to these issues, demographers typically use age-adjusted measures when comparing mortality rates over time or across countries. Simply adjusting for total population is insufficient. For example, Mexico and Japan have approximately the same total population. Although the risk of dying at any age is lower in Japan—as reflected by its higher life expectancy—there are actually fewer deaths each year in Mexico (at least ordinarily) because of its younger population.
Two commonly used age-adjusted measures of mortality are the age-standardised mortality rate and life expectancy. The former is defined as the weighted average of a nation’s current age-specific mortality rates, with the weights equal to the sizes of corresponding age groups in some standard population. Life expectancy is defined as the number of years an individual born in a given year would be expected to live if he were subject to the current age-specific mortality rates for the remainder of his life. These measures take into account both the risk of dying at different ages and the age structure of the population. But of the two, the age-standardised mortality rate is less intuitive.
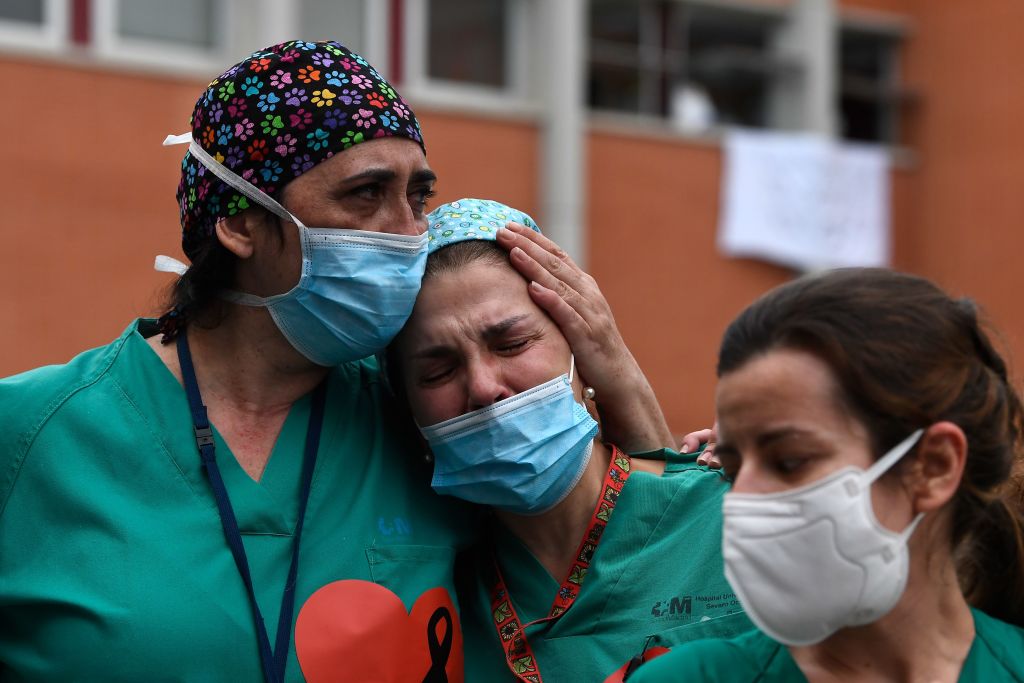
 Barbara Kay
The UK’s Office for National Statistics (ONS) has reported the age-standardised mortality rate in England each year going back to 2001. In 2020, it was higher than every year since 2008, which means that mortality is back at a level last seen in 2008. Although the ONS has not yet reported life expectancy for 2020, it has reported life expectancy for the years 2001–2019. And because life expectancy and the age-standardised mortality rate are almost perfectly correlated across years in England (r = .997), we can derive a reasonably accurate estimate of life expectancy for 2020. It comes out as 80.44, down from 81.75 in 2019—a drop of 1.3 years.
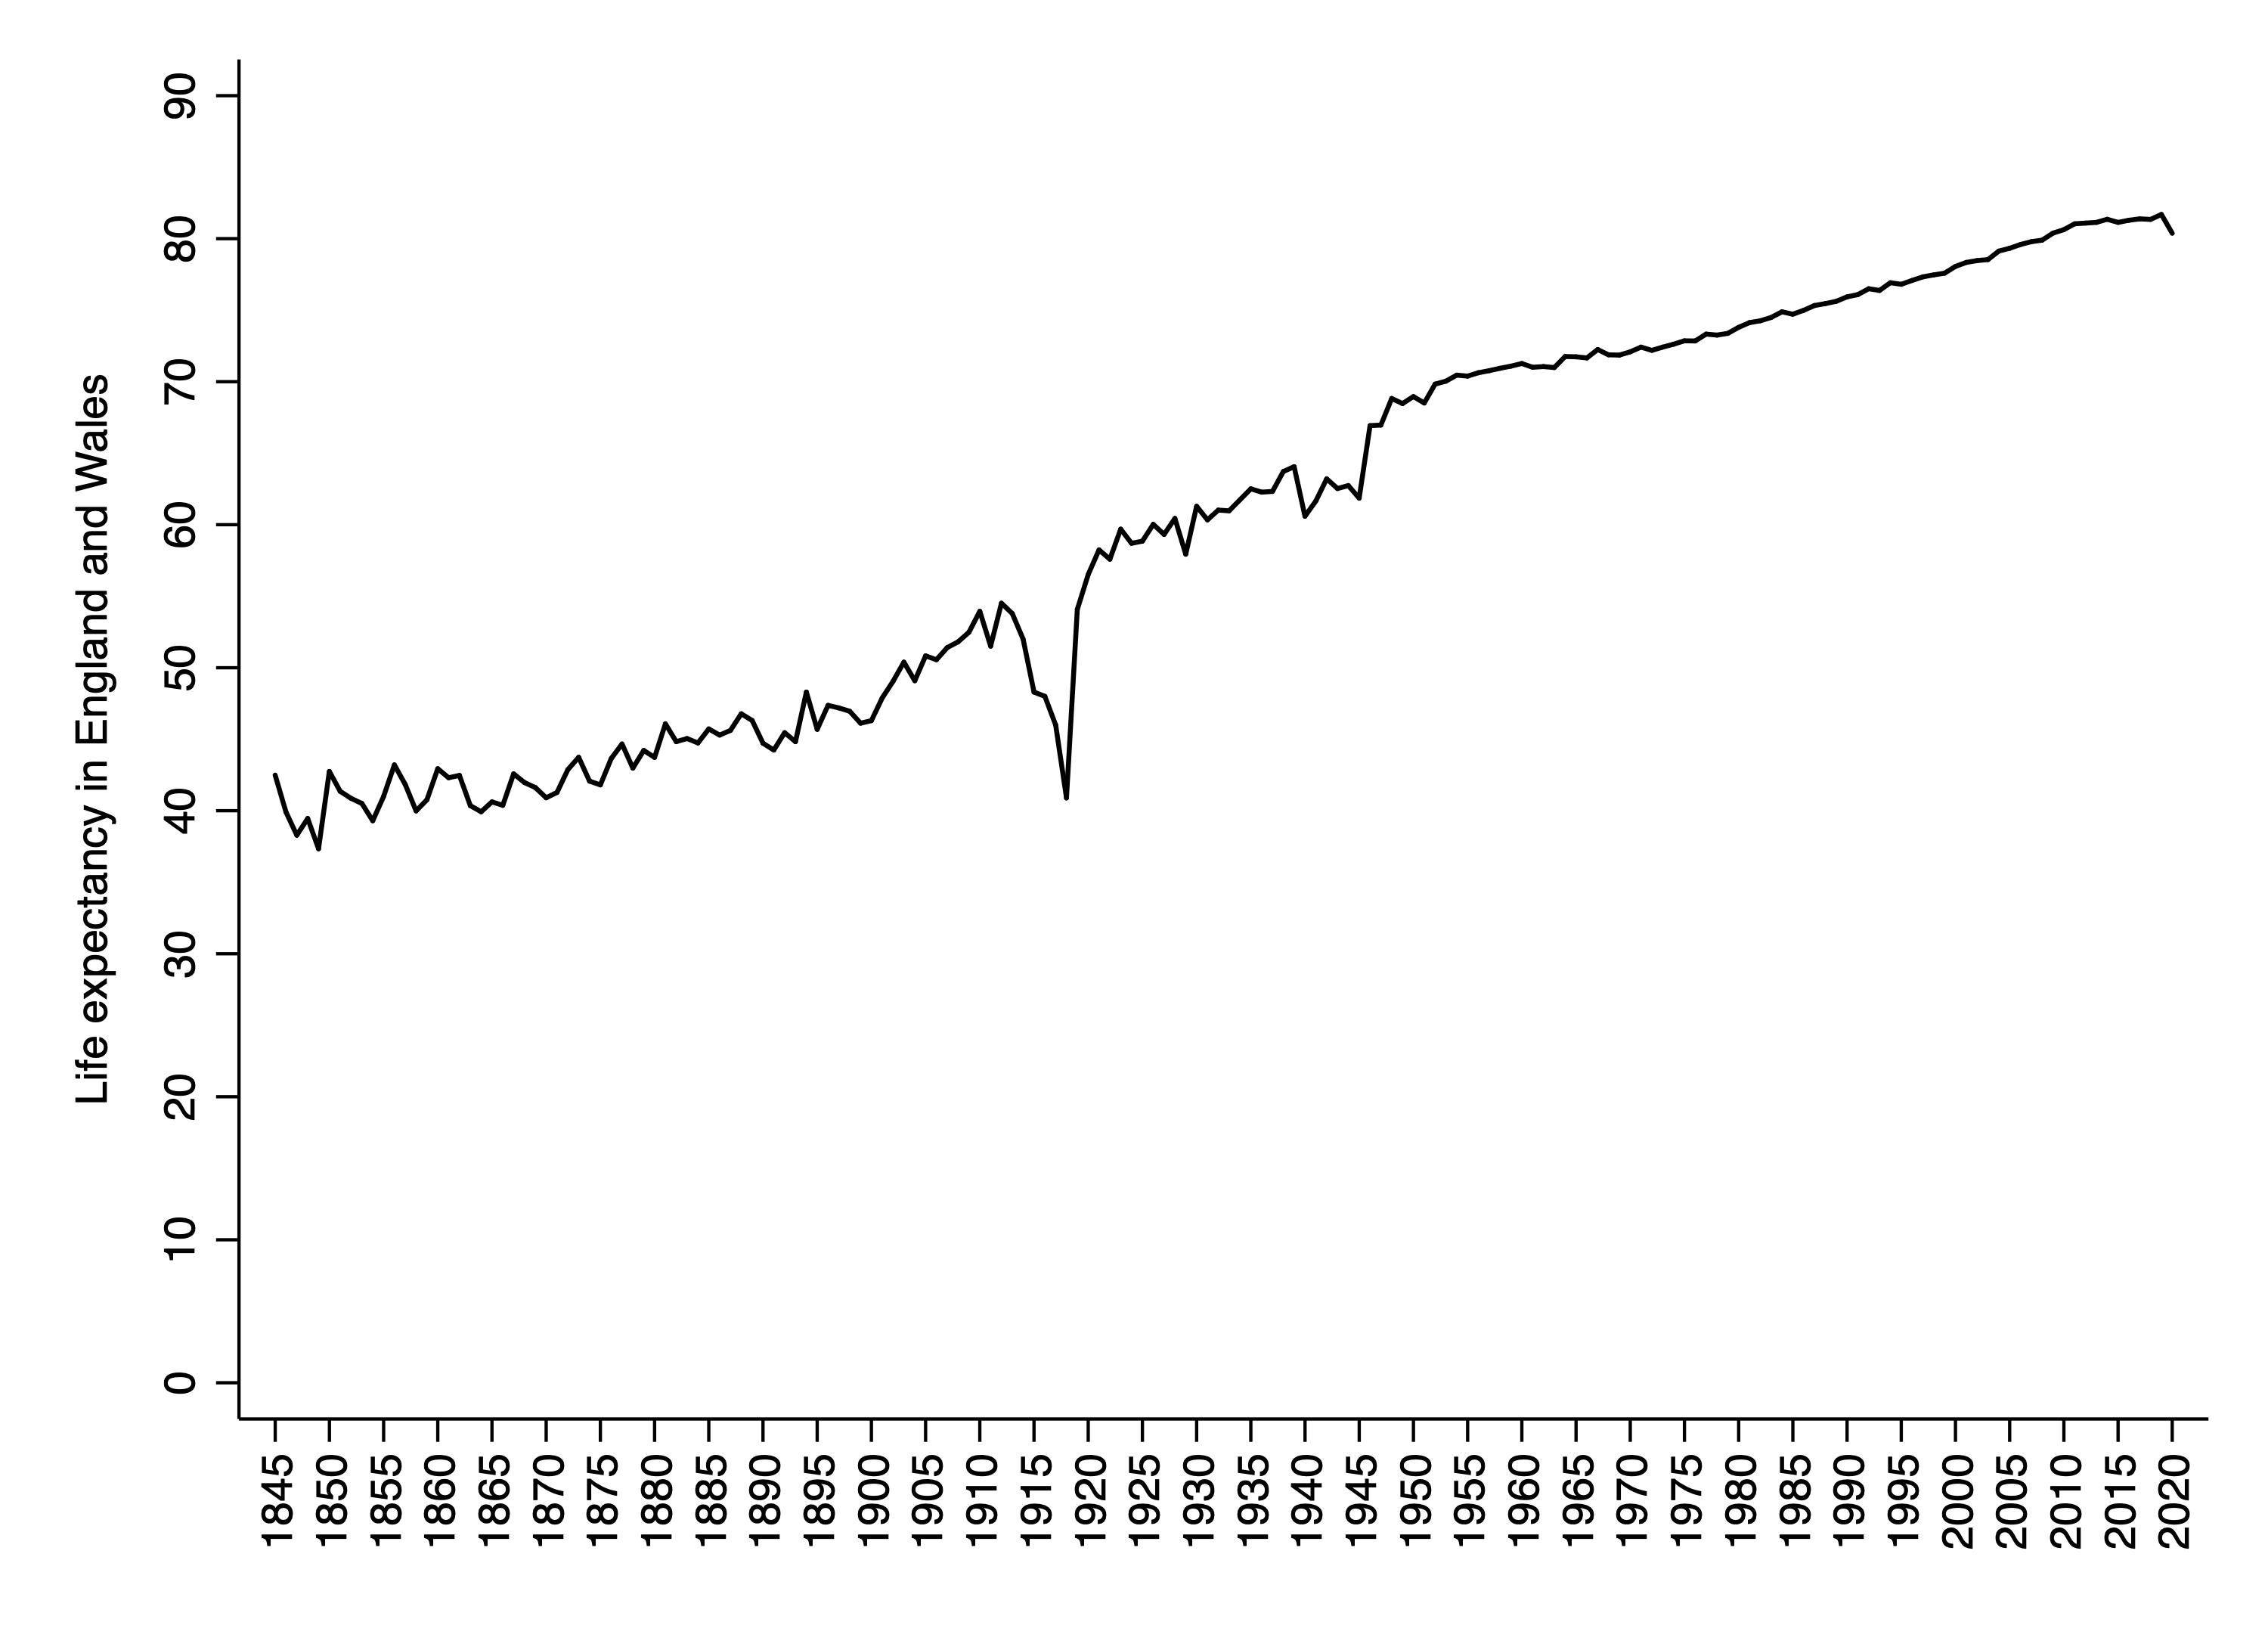
To help put this figure in historical perspective, I obtained data on life expectancy from the Human Mortality Database going all the way back to the 1840s. Because these estimates are for England and Wales, rather than just England, I made a small adjustment to the figures for 2019 and 2020. (Wales has a slightly lower life expectancy than England, although the statistical effect is small because its population comprises less than six percent of the total.)
While the numbers along the x-axis in the graph below are marked in five-year intervals, the zigs and zags correspond to individual years. The final downward zag corresponds to the COVID-19 pandemic. The trough in the 1940s corresponds to the Second World War. And the larger trough between 1914 and 1918 corresponds to the First World War and the Spanish flu pandemic. Some—but by no means all—of the long-term improvement in life expectancy is due to reductions in infant mortality.
In order to separate out the deadly effects of the Spanish flu from the deadly effects of the First World War, it is helpful to look at countries that remained neutral during that conflict. One such country is Spain. In fact, the disease became known as the “Spanish flu”—a misnomer—precisely because Spain’s leaders, unlike those of other large Western nations, did not feel compelled to censor early reports of the disease as a way to maintain morale.
Spain was among the hardest hit countries: In 1918, life expectancy fell by 12 years. Another hard-hit country was neutral Sweden, where life expectancy dropped by nine years. In the Netherlands (which also remained neutral) life expectancy fell by eight years. Surprisingly in Denmark, life expectancy dropped by only about one year. (All these figures can be found in the Human Mortality Database.)
Keep reading
On the Brink Again

They See Dead People

The Oldest Tradition in Art

The Tobacco Wars

Omer Bartov: What Went Wrong?

The Patriarchal Mind Virus