US Election
Serwer Error — Misunderstanding Trump Voters
Serwer's exit poll data misled on Trump voters. Reliable studies show working-class whites backed him, elites didn't.

A little over a month ago, the Atlantic published a long article by senior editor Adam Serwer entitled “The Nationalist’s Delusion.” The essay provoked considerable discussion and MSNBC’s Lawrence O’Donnell described it as “mandatory reading.” Serwer challenges the narrative that Trump’s unlikely electoral triumph was propelled by the economic estrangement of white working- and middle-class voters.
Rejecting this account, Serwer instead holds pervasive and deep-seated – if implicit – animosity towards non-white minorities primarily responsible for Trump’s election. To borrow a neologism from MSNBC’s Van Jones, the 2016 election outcome was just a case of ‘whitelash.’ Concerns over lax immigration policies, the flight of blue-collar jobs, Islamic terrorism (and the political obscurantism surrounding the subject), and a stifling culture of political correctness were all simply a pretext for the maintenance of white supremacy and racial inequality. A key data point Serwer draws on to support this claim is Trump’s s ‘sweeping victory’ across all income categories of white voters (emphasis added):
Trump defeated Clinton among white voters in every income category, winning by a margin of 57 to 34 among whites making less than $30,000; 56 to 37 among those making between $30,000 and $50,000; 61 to 33 for those making $50,000 to $100,000; 56 to 39 among those making $100,000 to $200,000; 50 to 45 among those making $200,000 to $250,000; and 48 to 43 among those making more than $250,000. In other words, Trump won white voters at every level of class and income. He won workers, he won managers, he won owners, he won robber barons. This is not a working-class coalition; it is a nationalist one.
In a recent article for Foreign Policy, the neoconservative writer and analyst Max Boot credited Serwer, and these figures specifically, for helping him to finally acknowledge his own ‘white privilege.’ The only problem is that the figures are incorrect. I’ve been studying the reputable American National Election Studies (ANES) 2016 election survey for almost a year now, so this was relatively easy to check. Below is a tabulated output of the ANES results. For ease of interpretation, the winning vote margin is highlighted in bold.
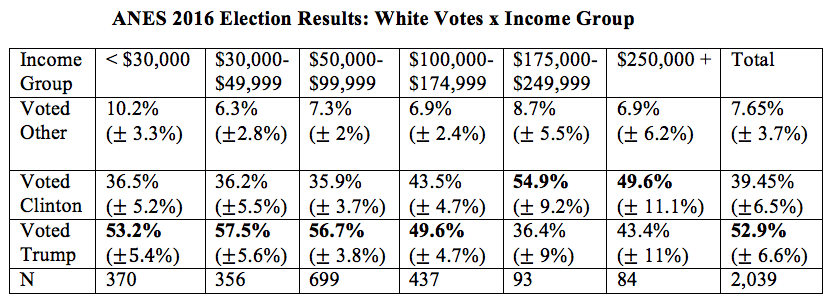
As we can see, Serwer’s claim begins to unravel as we surpass the middle-income bracket. From $175,000 and onward it’s not even close: non-Hispanic whites voted for Clinton by sizeable margins (18.5 percent and 6.2 percent). If we include Hispanic whites (40.4 percent of whom voted Trump), the spreads are even wider (21.3 percent and 10.32 percent). This is consistent with the working/middle-class ‘revenge against the elites’ thesis, but incompatible with that of an across-the-economic-board defence of white supremacy.
Three objections might be made at this point. The first is that the upper-income sample sizes are comparatively small (hence the wider margins of error). Although ANES employs random sampling that, in theory, should ensure representativeness, a larger sample size is always preferable. Second, one might argue that ANES’s breakdown of the income groups does not exactly correspond with those mentioned in Serwer’s article (there is, for example, no $200k category). While true, that hardly supports Serwer’s claim that Trump bested Clinton among whites of every income category. One need only point to the $250k+ bracket, which was included in Serwer’s figures and which shows Clinton winning pretty handily. Finally, how can I be so sure that it isn’t the ANES data — rather than Serwer’s – that are wrong?
For some reason Serwer does not provide a source for his data in his article. So I emailed him and discovered that it came from the Edison Research national exit poll, which he kindly attached. Given the well-known weaknesses of this kind of data (self-selection, incomplete demographic data, exclusion of early voters, and so on) and the availability now of much more complete and reliable datasets, I was puzzled that Serwer opted to rely upon election day polling. Still, I couldn’t assume a priori that the Edison data got it wrong. Cross-replication, preferably on a larger sample, was needed. So I turned to Harvard’s massive (N=64,600; roughly half of which voted) Cooperative Congressional Election Study (CCES) for a closer look, and my suspicions were confirmed:
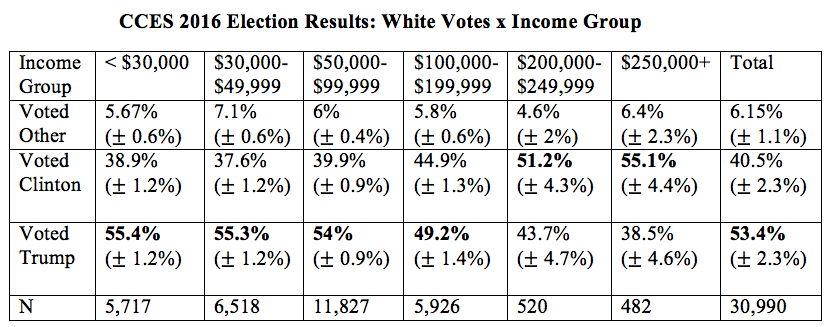
As in the ANES dataset, we once again find that white support for Trump trends markedly downward as we leave the lower to middle income brackets. Beyond the $100,000 mark, white voters increasingly turn out for Clinton. At $200k and onward, Clinton beats Trump by comfortable margins – 7.5 percent and 16.6 percent, respectively. For some perspective, I’ve also tabulated the exit poll figures cited by Serwer:
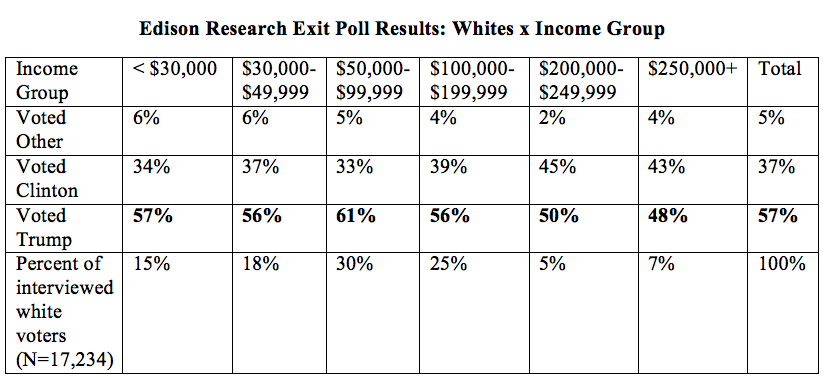
As we can see, whereas the ANES and CCES results are substantively similar, the Edison exit poll Serwer cites doesn’t come close. Given how far they fall from the CCES’ margins of error, the statistical probability that the Edison figures are accurate is exceedingly low. (In fact, they even fall outside of a wider margin of error derived from a 99 percent confidence interval. This means that the odds that the Edison figures accurately reflect the true distribution are less than 1 in 100.)
The reason for this glaring discrepancy isn’t immediately clear. My best guess is that the Edison data — gathered in real time from those who agreed to be interviewed after exiting the voting precincts (hence the risk of self-selection bias) — oversampled white Trump voters. Again, given the availability of alternative data sources, it’s perplexing why Serwer relied on an exit poll. But what’s even more bemusing is that Serwer didn’t bother to crosscheck it against other datasets. This is suggestive of journalistic laziness and more than a hint of confirmation bias.
But Serwer’s distortions don’t end there. In foregrounding racial resentment, he downplays the importance of other variables that help account for Trump’s election win. First, it should be noted the degree of anti-minority sentiment among Trump voters appears to be overstated. According to the ANES out-group feeling thermometer data (scored along a 0-100 scale), Trump voters, on average, evaluated Blacks (mean=63.8) and Hispanics (mean=64.4) in the ‘warm’ direction. By comparison, the mean ratings for both of these groups among Clinton voters were 75 and 73.9, respectively—warmer, but not as much as one might expect.
Second, while Serwer blames Trump’s presidency on racial resentment, one could just as easily point the finger at ‘PC fatigue’. For example, a recent Cato study found that 58 percent of Americans believe “that the political climate today prevents them from saying things they believe.” And whereas 73 percent of Republicans and 58 percent of independents endorsed this statement, a majority of Democrats (53 percent) did not. As this relates to the election, my own research — which I’ll soon be submitting for publication — finds that even after controlling for various measures of prejudice (sexism, hatred of minorities, racial resentment, etc.), issue-attitudes (economic discontent, immigration, refugees, etc.), and ideological orientations (authoritarianism, social dominance orientation), opposition to political correctness significantly predicts voting for Trump. This finding is consistent with the results of a recent experimental study, which found that priming ‘PC norms’ elicited greater support for Trump (and greater opposition to Clinton) irrespective of political ideology. Likewise, I found that even among Clinton voters, greater opposition to PC linearly coincided with greater positivity (albeit still negative) towards Trump.
Keep reading
The Miseducation of American Journalists

The Enemy Within


A Tale of Two Settlements